
Gate 1 — Circle of Competence
| Question | Analysis | Result |
|---|---|---|
| Business samajh aata hai? | Haan. IT Services & Digital Transformation company hai. | ✅ |
| Revenue model clear hai? | Clients ko software development, consulting, cloud, AI, cybersecurity, ERP, outsourcing services provide karti hai. Revenue long-term contracts se aata hai. | ✅ |
| Customers kaun hain? | Banks, Insurance, Manufacturing, Retail, Healthcare, Telecom, Government, Energy, Airlines etc. | ✅ |
| Competitors kaun hain? | Infosys, HCLTech, Wipro, Accenture, Cognizant. | ✅ |
| Industry samajh aati hai? | Mature IT Services industry hai. | ✅ |
Gate 1 Result
✅ PASS
Gate 2 — Business Simplicity
| Question | Analysis | Result |
|---|---|---|
| Revenue predictable? | Large multi-year contracts ki wajah se kaafi predictable. | ✅ |
| Cash Flow predictable? | Har saal strong operating cash flow generate karti hai. | ✅ |
| Business model simple? | Employee hire karo → IT services do → recurring revenue earn karo. | ✅ |
| Earnings cyclical nahi? | Economic slowdown se impact hota hai, lekin manufacturing ya commodity companies jitna cyclical nahi. | ✅ |
Gate 2 Result
✅ PASS
Gate 3 — Long-Term Relevance
| Question | Analysis | Result |
|---|---|---|
| 10–20 saal baad demand hogi? | Digital transformation, AI, Cloud aur Cybersecurity ki demand likely rahegi. | ✅ |
| Technology disrupt karegi? | AI disruption risk hai, lekin TCS khud AI adopt aur deploy kar rahi hai. | ✅ |
| Government risk manageable? | Global regulations aur visa policies risk hain, lekin diversified operations se manageable. | ✅ |
| Industry survive karegi? | IT Services industry long-term survive karne ki strong possibility. | ✅ |
Gate 3 Result
✅ PASS
Gate 4 — Governance Red Flags
| Check | Status |
|---|---|
| Proven Fraud | ❌ Nahi mila |
| Accounting Manipulation | ❌ Koi proven evidence nahi |
| Auditor Resignation | ❌ Nahi. Statutory auditor ne unmodified opinion diya hai. |
| SEBI Major Action | ❌ Koi major governance-related action nahi mila. |
| Promoter Pledge | ✅ 0% pledge (Tata Group promoter holding generally unpledged). |
| Serious Governance Issues | ❌ Nahi |
Governance Score
✅ PASS
Hard Reject Rules
| Rule | Status |
|---|---|
| Proven fraud | ❌ No |
| Accounting manipulation | ❌ No |
| Auditor resignation | ❌ No |
| Promoter pledge >50% | ❌ No (0%) |
| Continuous negative Operating Cash Flow | ❌ No |
| Repeated equity dilution | ❌ No |
| Serious governance failures | ❌ No |
| Outside Circle of Competence | ❌ No |
View
Moat
✅ Brand
✅ Scale
✅ Customer relationships
✅ Switching Cost
✅ Execution capability
Business Summary
- Headquarters: Mumbai
- Parent Group: Tata Group
- Industry: IT Services & Consulting
- Clients: 50+ countries
- Employees: 600,000+ globally (approx.)
Final Stage 1 Score
| Gate | Result |
|---|---|
| Circle of Competence | ✅ PASS |
| Business Simplicity | ✅ PASS |
| Long-Term Relevance | ✅ PASS |
| Governance | ✅ PASS |
1️⃣ Business Quality (20 Marks)
Company: Tata Consultancy Services
Note: Neeche diye gaye figures FY2025 (latest annual data) aur historical CAGR trends par based rounded values hain. Exact values source/methodology ke hisaab se thodi vary kar sakti hain.
| Metric | Latest Data | Rating |
|---|---|---|
| Revenue (FY25) | ~₹2.55 lakh crore | ⭐⭐⭐⭐⭐ |
| Revenue CAGR (5Y) | ~11% | 9/10 |
| Revenue CAGR (10Y) | ~10% | 9/10 |
| Net Profit (FY25) | ~₹48,500 crore | ⭐⭐⭐⭐⭐ |
| Profit CAGR (5Y) | ~10–11% | 9/10 |
| EPS CAGR (5Y) | ~10% | 9/10 |
| Gross Margin | N/A (IT services mein meaningful metric nahi) | — |
| EBITDA Margin | ~27% | ⭐⭐⭐⭐⭐ |
| Operating Margin (EBIT) | ~24% | ⭐⭐⭐⭐⭐ |
| Net Profit Margin | ~19% | ⭐⭐⭐⭐⭐ |
| ROE | ~52% | ⭐⭐⭐⭐⭐ |
| ROCE | ~63% | ⭐⭐⭐⭐⭐ |
| ROIC | ~50%+ | ⭐⭐⭐⭐⭐ |
| Operating Cash Flow | ~₹52,000 crore | ⭐⭐⭐⭐⭐ |
| Free Cash Flow | ~₹46,000 crore | ⭐⭐⭐⭐⭐ |
| Cash Conversion (FCF/Net Profit) | ~95% | Excellent |
| Earnings Consistency | 20+ years of profit | Excellent |
| Margin Stability | Very Stable | Excellent |
Detailed Assessment
1. Revenue Growth
- 5-Year Revenue CAGR: ~11% ✅
- 10-Year Revenue CAGR: ~10% ✅
- Growth steady hai, hyper-growth nahi, but highly predictable.
Score: 3.5 / 4
2. Profit Growth
- Profit CAGR: ~10–11%
- EPS CAGR: ~10%
- Profit consistently grows with Hua Hai.
Score: 3.5 / 4
3. Profitability
- EBITDA Margin: ~27%
- Operating Margin: ~24%
- Net Margin: ~19%
- Industry ke best margins mein se ek.
Score: 4 / 4
4. Returns on Capital
- ROE: ~52%
- ROCE: ~63%
- ROIC: 50%+
Ye world-class capital efficiency dikhata hai.
Score: 4 / 4
5. Cash Generation & Stability
- Strong Operating Cash Flow ✅
- Strong Free Cash Flow ✅
- Cash Conversion ~95% ✅
- Earnings aur margins bahut stable ✅
Score: 5 / 4 (Capped at 4 / 4)
Final Business Quality Score
| Category | Score |
|---|---|
| Revenue Growth | 3.5 / 4 |
| Profit Growth | 3.5 / 4 |
| Margins | 4 / 4 |
| Returns | 4 / 4 |
| Cash Flow & Stability | 5 / 4 → 4 / 4 |
Business Quality Score: 19 / 20 ⭐⭐⭐⭐⭐
Verdict
- ✅ Predictable revenue
- ✅ High margins
- ✅ Excellent ROE, ROCE, ROIC
- ✅ Strong free cash flow
- ✅ Consistent earnings
- ✅ Very stable business model
Business Quality Rating: 19/20 (Excellent)
Economic Moat (10 Marks)
Company: Tata Consultancy Services
| Moat Factor | Analysis | Score |
|---|---|---|
| Brand | Tata Group ki credibility + global enterprise brand. Fortune 500 companies ka trusted IT partner. | 1.5 / 1.5 |
| Switching Cost | Large clients ke liye vendor change karna expensive aur risky hota hai (ERP, core banking, cloud, legacy systems). | 1.5 / 1.5 |
| Cost Advantage | India-based delivery model, offshore centers aur operational efficiency se cost advantage milta hai. | 1 / 1 |
| Scale Advantage | 600,000+ employees, global delivery network aur diversified client base. Scale competitors ke liye replicate karna mushkil. | 1.5 / 1.5 |
| Network Effect | Direct network effect (jaise Visa ya Meta) nahi hai, lekin ecosystem relationships strong hain. | 0.5 / 1 |
| Patents / IP | Proprietary platforms (jaise BaNCS, ignio ecosystem partnerships, AI solutions) hain, lekin moat IP par heavily dependent nahi. | 0.5 / 1 |
| Pricing Power | Premium pricing charge kar sakti hai, especially long-term enterprise relationships mein. | 1 / 1 |
| Market Leadership | India ki largest IT services companies mein se ek; global top IT service providers mein strong position. | 1 / 1 |
| Distribution Strength | 50+ countries mein delivery centers, global sales force aur deep enterprise reach. | 0.5 / 0.5 |
Total Score
| Category | Score |
|---|---|
| Economic Moat | 9.0 / 10 |
Moat Rating
⭐⭐⭐ Strong
Strengths
- ✅ Powerful Tata brand
- ✅ High client switching costs
- ✅ Massive global scale
- ✅ Strong cost advantage
- ✅ Long-term enterprise relationships
- ✅ Excellent execution capability
Weaknesses
- ❌ Direct network effect is limited
- ❌ Patent/IP-driven moat relatively weaker than software product companies
- ❌ Competition from global IT firms (Accenture, Infosys, HCLTech, Cognizant)
Verdict
TCS ka moat durable hai. Iska competitive advantage brand + execution + client relationships + switching costs + scale par based hai, jo long term mein defendable hai.
Management & Governance (10 Marks)
Company: Tata Consultancy Services
| Parameter | Analysis | Score |
|---|---|---|
| Promoter Holding | ~71.8% (Tata Sons) – High, stable promoter ownership. | 1.0 / 1.0 |
| Promoter Buying / Selling | Promoter holding largely stable. No concerning trend of continuous stake reduction. | 0.5 / 0.5 |
| Promoter Pledging | 0% pledged shares. | 1.0 / 1.0 |
| Auditor Quality | Big global audit firm, clean audit opinions in recent years. | 1.0 / 1.0 |
| Auditor Resignation History | No material red flags or unexplained auditor resignation. | 0.5 / 0.5 |
| Independent Directors | Strong and experienced independent board with governance oversight. | 0.5 / 0.5 |
| Related Party Transactions | Mostly Tata Group transactions; disclosed and generally at arm’s length. No major governance concerns. | 0.5 / 0.5 |
| Accounting Quality | Conservative accounting, strong cash conversion, no major accounting controversies. | 1.0 / 1.0 |
| SEBI / Regulatory Action | No major governance-related SEBI action affecting management credibility. | 0.5 / 0.5 |
| Dividend Policy | Consistent dividend payer with high shareholder payouts. | 0.75 / 0.75 |
| Buyback Policy | Has historically returned excess cash through periodic buybacks. | 0.75 / 0.75 |
| Acquisitions | Disciplined, mostly small strategic acquisitions; no large value-destructive deals. | 0.5 / 0.5 |
| Debt Reduction | Debt-light / effectively net-cash balance sheet. | 0.5 / 0.5 |
| Guidance vs Actual Execution | Strong execution history, though management typically gives conservative guidance. | 0.5 / 0.5 |
| Capital Efficiency | Exceptional ROE, ROCE and cash generation over many years. | 1.0 / 1.0 |
Category-wise Score
| Category | Score |
|---|---|
| Promoter Quality | 2.5 / 2.5 |
| Governance | 3.5 / 3.5 |
| Capital Allocation | 2.5 / 2.5 |
| Execution | 1.5 / 1.5 |
Final Management & Governance Score
9.8 / 10 ⭐⭐⭐⭐⭐
Strengths
- ✅ Strong Tata Group promoter
- ✅ 0% promoter pledge
- ✅ High promoter holding
- ✅ Clean governance record
- ✅ Conservative accounting
- ✅ Consistent dividend policy
- ✅ Regular buybacks
- ✅ Excellent capital allocation
- ✅ Debt-light balance sheet
- ✅ Outstanding execution track record
Minor Risks
- ⚠ IT industry growth depends on global enterprise spending.
- ⚠ Large company size makes very high growth harder than in earlier years.
Final Verdict
Management Quality: ⭐⭐⭐⭐⭐ (Excellent)
Governance Quality: ⭐⭐⭐⭐⭐ (Excellent)
Financial Strength (10 Marks)
Company: Tata Consultancy Services
| Parameter | Latest Status | Score |
|---|---|---|
| Debt / Equity | ~0.00 (Virtually debt-free) | 1.5 / 1.5 |
| Net Debt | Net Cash Company (Cash > Debt) | 1.0 / 1.0 |
| Cash & Investments | ₹65,000–70,000 Cr+ (Cash, bank balance & investments) | 1.0 / 1.0 |
| Current Ratio | ~2.2x | 1.0 / 1.0 |
| Quick Ratio | ~2.2x | 1.0 / 1.0 |
| Interest Coverage | Extremely High (>100x due to negligible debt) | 1.0 / 1.0 |
| Altman Z-Score | Estimated >6 (Very Safe Zone) | 1.0 / 1.0 |
| Operating Cash Flow | ~₹52,000 Cr (Strong & Consistent) | 1.0 / 1.0 |
| Free Cash Flow | ~₹46,000 Cr | 1.0 / 1.0 |
| Credit Rating | Highest quality corporate profile (AAA equivalent domestic ratings for borrowings where applicable) | 0.5 / 0.5 |
Category-wise Analysis
1. Balance Sheet
- ✅ Virtually debt-free
- ✅ Large cash reserves
- ✅ Net cash balance sheet
Score: 3.5 / 3.5
2. Liquidity
- ✅ Current Ratio >2
- ✅ Quick Ratio >2
- ✅ Excellent short-term liquidity
Score: 2 / 2
3. Solvency
- ✅ Interest Coverage extremely high
- ✅ Altman Z-Score well above distress zone
Score: 2 / 2
4. Cash Flow
- ✅ Strong Operating Cash Flow
- ✅ Strong Free Cash Flow
- ✅ Excellent cash conversion
Score: 2 / 2
5. Credit Quality
- ✅ Excellent credit profile
- ✅ Strong financial flexibility
Score: 0.5 / 0.5
Final Financial Strength Score
| Category | Score |
|---|---|
| Balance Sheet | 3.5 / 3.5 |
| Liquidity | 2.0 / 2.0 |
| Solvency | 2.0 / 2.0 |
| Cash Flow | 2.0 / 2.0 |
| Credit Quality | 0.5 / 0.5 |
Financial Strength Score: 10 / 10 ⭐⭐⭐⭐⭐
Verdict
- ✅ Debt-free balance sheet
- ✅ Net cash position
- ✅ Excellent liquidity
- ✅ Outstanding solvency
- ✅ Massive and consistent free cash flow
- ✅ Very low financial risk
Growth Analysis (10 Marks)
Company: Tata Consultancy Services
| Growth Parameter | Analysis | Score |
|---|---|---|
| Revenue Growth (Historical) | 5Y Revenue CAGR ~11%, 10Y ~10%. Consistent double-digit growth. | 1.5 / 2.0 |
| EPS Growth | 5Y EPS CAGR ~10%, supported by strong margins and buybacks. | 1.0 / 1.5 |
| Profit Growth | Net Profit CAGR ~10–11%, steady despite global slowdown. | 1.0 / 1.5 |
| Management Guidance | Conservative guidance with strong execution history. | 1.0 / 1.0 |
| Industry Growth | Long-term demand driven by Cloud, AI, Cybersecurity and Digital Engineering. | 1.0 / 1.0 |
| Capacity Expansion | Hiring, global delivery centers and AI-enabled workforce expansion. | 0.75 / 1.0 |
| AI Investment | Significant investments in Generative AI, AI platforms and enterprise AI solutions. | 1.0 / 1.0 |
| Digital Transformation | Core growth engine; strong order wins in cloud modernization and digital services. | 1.0 / 1.0 |
| New Products / Platforms | Continuous development of proprietary platforms (e.g., TCS BaNCS, AI offerings) and industry-specific solutions. | 0.5 / 0.5 |
| New Markets / Export Growth | Global presence across 50+ countries with diversified client base. Export-led business continues to expand. | 0.5 / 0.5 |
Category-wise Analysis
1. Historical Growth
- ✅ Revenue CAGR around 10–11%
- ✅ Profit CAGR around 10–11%
- ✅ EPS growth supported by buybacks
Score: 3.5 / 5
2. Future Growth Drivers
- ✅ Enterprise AI adoption
- ✅ Cloud migration
- ✅ Cybersecurity demand
- ✅ Digital transformation spending
- ✅ Long-term outsourcing trend
Score: 5.0 / 5
Strengths
- ✅ Predictable long-term growth
- ✅ Global digital transformation demand
- ✅ Heavy investment in AI
- ✅ Diversified industries and geographies
- ✅ Strong execution capability
Risks
- ⚠ Mature company; 20–25% annual growth is unlikely.
- ⚠ Global recession or lower IT spending can temporarily slow growth.
- ⚠ Currency fluctuations and visa regulations may affect margins.
Verdict
TCS is not a high-growth company, but it is a high-quality compounder. It is well-positioned to benefit from AI adoption, cloud migration, and enterprise digital transformation over the next decade.
Growth Analysis Score: 9 / 10 ⭐⭐⭐⭐☆
Value Investing (Historical) (5 Marks)
Company: Tata Consultancy Services
Purpose : Yeh section current valuation nahi, balki historical valuation range ko judge karta hai. Isse pata chalta hai ki stock historically kab cheap aur kab expensive trade hua hai.
| Historical Metric | Analysis | Score |
|---|---|---|
| Historical P/E | Long-term average ~24–30x. Panic periods (2020, 2022–23 corrections) mein ~18–22x tak mila. Above 35x generally expensive maana gaya. | 1.5 / 2.0 |
| Historical P/B | Generally 10–15x range. Asset-light IT business hone ki wajah se high P/B normal hai. | 0.5 / 0.5 |
| Historical EV/EBITDA | Mostly 18–24x range. Quality premium consistently maintain kiya. | 1.0 / 1.0 |
| Historical Dividend Yield | Usually 1.2–2.0%, market corrections mein 2.5–3% tak pahunch sakta hai. Consistent dividend history. | 0.5 / 0.5 |
| Margin of Safety / Mr. Market / Fear vs Greed | TCS rarely deep discount par milta hai. Best buying opportunities fear-driven corrections (COVID, global IT slowdown) mein aati hain. Quality premium justify hota hai. | 0.5 / 1.0 |
Historical Valuation Summary
| Parameter | Verdict |
|---|---|
| Historical PE | Premium but justified |
| Historical PB | Premium (Normal for asset-light IT) |
| Historical EV/EBITDA | Premium |
| Historical Dividend Yield | Stable & Consistent |
| Margin of Safety | Available mainly during market corrections |
View
- ✅ High-quality companies aksar permanently “cheap” nahi milti.
- ✅ TCS historically quality premium par trade karti rahi hai.
- ✅ Best buying opportunities tab aati hain jab market fear mein ho aur valuation apne historical average se niche aa jaye.
Final Value Investing (Historical) Score
| Category | Score |
|---|---|
| Historical Valuation | 4.5 / 5 |
Score: 4.5 / 5 ⭐⭐⭐⭐⭐
Verdict
Historical Rating: Premium Quality Compounder
- ✅ Historically premium valuation
- ✅ Consistent dividend payer
- ✅ Strong margin of safety only during corrections
- ✅ Long-term investors ke liye excellent business, lekin entry price ka discipline important hai.
Valuation (15 Marks)
Company: Tata Consultancy Services
Purpose : Is section ka objective hai company ki actual intrinsic value estimate karna aur dekhna ki current market price uske comparison mein cheap, fair ya expensive hai.
A. Intrinsic Value
| Method | Estimated Value | Score |
|---|---|---|
| DCF (Discounted Cash Flow) | ₹3,650–3,900 | 4.0 / 5.0 |
| Reverse DCF | Current valuation implies ~8–10% long-term earnings growth, jo TCS ke liye reasonable hai. | 2.0 / 2.5 |
| Owner Earnings | Strong, predictable cash generation; owner earnings almost FCF ke barabar. | 2.0 / 2.5 |
B. Relative Valuation
| Metric | Analysis | Score |
|---|---|---|
| PEG Ratio | ~2–3; growth ke hisaab se premium valuation. | 1.0 / 2.0 |
| P/E | Sector average se premium par trade karta hai, justified by quality. | 1.5 / 2.0 |
| EV/EBITDA | Premium multiple, lekin consistent margins aur ROCE justify karte hain. | 1.0 / 1.5 |
| Peer Comparison | Infosys, HCLTech, Wipro se generally premium valuation due to stronger execution and governance. | 1.5 / 2.0 |
C. Fair Value
| Parameter | Estimate |
|---|---|
| Fair Value Range | ₹3,650 – ₹3,900 |
| Undervalued Zone | Below ₹3,500 |
| Strong Buy Zone | ₹3,200 – ₹3,400 |
| Overvalued Zone | Above ₹4,200 |
Sensitivity Analysis
| Long-term Growth Assumption | Estimated Intrinsic Value |
|---|---|
| 8% | ~₹3,500 |
| 10% | ~₹3,750 |
| 12% | ~₹4,000 |
Valuation Summary
| Item | Verdict |
|---|---|
| DCF | ✅ Fairly Valued |
| Reverse DCF | ✅ Reasonable Expectations |
| Owner Earnings | ✅ Excellent |
| Relative Valuation | ⚠ Slight Premium |
| Fair Value | ₹3,650–3,900 |
Final Valuation Score
| Category | Score |
|---|---|
| Intrinsic Value | 8.0 / 10.0 |
| Relative Valuation | 5.0 / 7.0 |
| Total | 13 / 15 |
Valuation Score: 13 / 15 ⭐⭐⭐⭐☆
Verdict
- ✅ Excellent business with strong owner earnings.
- ✅ Intrinsic value supports long-term investment.
- ⚠ TCS generally trades at a quality premium, so extraordinary bargains are uncommon.
- ✅ For long-term investors, buying below intrinsic value (preferably below ₹3,500) offers a better margin of safety.
Macro Analysis (5 Marks)
Company: Tata Consultancy Services
Framework: (Macro & Economic Cycle)
| Macro Factor | Impact on TCS | Score |
|---|---|---|
| GDP Growth | 🌟 Positive. Global GDP growth increases enterprise IT spending; India remains one of the fastest-growing major economies. | 0.8 / 1.0 |
| Inflation | ⚠ Moderate impact. Higher inflation raises employee costs, but TCS has pricing power and operational efficiency to offset part of it. | 0.6 / 0.75 |
| Interest Rates | ⚠ Higher global interest rates can delay client IT budgets. Falling rates are supportive. | 0.5 / 0.75 |
| USD/INR | ✅ Positive. Most revenue is earned in USD and other foreign currencies, so a weaker INR generally benefits revenue and margins. | 0.75 / 0.75 |
| Commodity Prices | ✅ Very low impact because TCS is an asset-light services company. | 0.5 / 0.5 |
| Economic Cycle | ⚠ Sensitive to global recession, but mission-critical IT outsourcing makes earnings relatively resilient. | 0.6 / 0.75 |
| Global Demand | ✅ Strong long-term demand from AI, Cloud, Cybersecurity and Digital Transformation. | 0.5 / 0.5 |
Category-wise Analysis
Positive Macro Drivers
- ✅ India’s structural economic growth
- ✅ Long-term global digital transformation
- ✅ AI adoption across enterprises
- ✅ Cloud migration
- ✅ Weak INR generally benefits export earnings
- ✅ Low dependence on commodity prices
Macro Risks
- ⚠ US and Europe recession
- ⚠ Delayed enterprise technology spending
- ⚠ Higher wage inflation
- ⚠ Global interest rate uncertainty
- ⚠ Geopolitical disruptions
Verdict
TCS ka business global macro cycle se influence hota hai, lekin uski diversified client base, recurring contracts aur export-oriented model macro shocks ko kaafi had tak absorb kar leta hai.
| Category | Score |
|---|---|
| GDP | 0.8 / 1.0 |
| Inflation | 0.6 / 0.75 |
| Interest Rate | 0.5 / 0.75 |
| USD/INR | 0.75 / 0.75 |
| Commodity Prices | 0.5 / 0.5 |
| Economic Cycle | 0.6 / 0.75 |
| Global Demand | 0.5 / 0.5 |
Final Macro Analysis Score: 4.25 / 5 ⭐⭐⭐⭐☆
Overall Rating
- Macro Tailwind: ⭐⭐⭐⭐☆
- Risk Level: Moderate
- Long-term Outlook: Positive
Risk Analysis (5 Marks)
Company: Tata Consultancy Services
Framework: (Risk First, Return Second)
| Risk Factor | Analysis | Score |
|---|---|---|
| Customer Concentration | ✅ Diversified client base across industries and geographies. No excessive dependence on a single customer. | 0.75 / 1.0 |
| Supplier Risk | ✅ Low. Main resource is skilled employees, not raw material suppliers. | 0.50 / 0.50 |
| Debt Risk | ✅ Virtually debt-free balance sheet. | 0.75 / 0.75 |
| Cash Burn Risk | ✅ Strong operating & free cash flow. No cash burn concerns. | 0.75 / 0.75 |
| Regulatory Risk | ⚠ Visa rules, data privacy laws and global compliance requirements create moderate risk. | 0.40 / 0.50 |
| Technology Risk | ⚠ AI disruption is a risk, but TCS is investing heavily in AI and digital capabilities. | 0.60 / 0.75 |
| Geopolitical Risk | ⚠ Global conflicts, recession, currency volatility and trade restrictions can affect client spending. | 0.40 / 0.50 |
Scenario Analysis
| Scenario | Probability | Expected Impact |
|---|---|---|
| 🐻 Bear Case | 20% | Global recession, reduced IT budgets, revenue growth slows to 5–7%, margins compress by 1–2%. |
| ⚖ Base Case | 60% | Stable enterprise IT spending, revenue growth around 8–10%, margins remain stable. |
| 🐂 Bull Case | 20% | AI, Cloud and Digital Transformation accelerate, revenue growth 12–14%, margins improve slightly. |
Risk Assessment
Business Risk
- ✅ Diversified clients
- ✅ Strong recurring revenue
- ✅ High employee retention and execution capability
Risk Level: Low
Financial Risk
- ✅ Net cash company
- ✅ Strong liquidity
- ✅ No refinancing risk
Risk Level: Very Low
External Risk
- ⚠ Global recession
- ⚠ AI-driven disruption
- ⚠ Currency fluctuations
- ⚠ Regulatory changes
Risk Level: Moderate
Verdict
TCS ke risks business failure wale nahi, balki growth slowdown wale hain. Company financially bahut strong hai aur downside ko absorb karne ki capacity rakhti hai.
| Category | Score |
|---|---|
| Business Risk | 1.25 / 1.50 |
| Financial Risk | 1.50 / 1.50 |
| External Risk | 1.40 / 2.00 |
Final Risk Analysis Score: 4.25 / 5 ⭐⭐⭐⭐☆
Overall Risk Rating
- Business Risk: 🟢 Low
- Financial Risk: 🟢 Very Low
- External Risk: 🟡 Moderate
- Overall Risk Profile: Low to Moderate
Quant Verification (5 Marks)
Company: Tata Consultancy Services
Framework: (Quantitative Verification)
| Quant Factor | Analysis | Score |
|---|---|---|
| Revenue Stability | ✅ Revenue has grown consistently over the last 10–15 years with very few major declines. | 0.80 / 1.00 |
| EPS Stability | ✅ EPS growth is steady with low volatility and consistent compounding. | 0.75 / 0.75 |
| Margin Stability | ✅ Operating margin has remained around 24–26% for many years. | 0.75 / 0.75 |
| Beta | ~0.6–0.8 (Lower than market, relatively defensive). | 0.50 / 0.50 |
| Volatility | ✅ Lower price volatility than most IT stocks and the broader market. | 0.40 / 0.50 |
| Sharpe Ratio | ✅ Long-term risk-adjusted returns have been attractive. | 0.40 / 0.50 |
| Maximum Drawdown | ⚠ During major market corrections, drawdowns of 30–40% have occurred, but recovery has historically been strong. | 0.40 / 0.50 |
| Backtesting | ✅ Long-term buy-and-hold strategy has significantly outperformed many peers and the market over multiple cycles. | 0.50 / 0.50 |
Quantitative Summary
Stability
- ✅ Predictable revenue
- ✅ Stable EPS growth
- ✅ Consistent operating margins
Risk Metrics
- ✅ Low Beta
- ✅ Moderate volatility
- ✅ Strong risk-adjusted returns
Historical Performance
- ✅ Strong long-term compounding
- ✅ Recovers well after market corrections
- ✅ Suitable for long-term investors
Verdict
TCS has one of the strongest quantitative profiles among large-cap Indian IT companies. While it is not a momentum stock, it scores highly on stability, consistency, and long-term compounding, making it attractive for systematic long-term portfolios.
| Category | Score |
|---|---|
| Stability | 2.30 / 2.50 |
| Risk Metrics | 1.30 / 1.50 |
| Historical Performance | 0.90 / 1.00 |
Final Quant Verification Score: 4.5 / 5 ⭐⭐⭐⭐⭐
Overall Quant Rating
- Revenue Stability: 🟢 Excellent
- EPS Stability: 🟢 Excellent
- Margin Stability: 🟢 Excellent
- Risk Profile: 🟢 Low
- Long-term Quant Score: Excellent (4.5/5)
Technical Confirmation (2.5 Marks)
Company: Tata Consultancy Services
Purpose: Technical analysis ka objective company ki quality judge karna nahi, balki best entry timing identify karna hai.
| Technical Factor | Analysis | Score |
|---|---|---|
| 20 EMA | ✅ Price generally 20 EMA ke upar ho to short-term trend bullish maana jata hai. | 0.25 / 0.30 |
| 50 EMA | ✅ Medium-term trend positive. | 0.25 / 0.30 |
| 200 EMA | ✅ Long-term trend remains bullish as long as price stays above 200 EMA. | 0.30 / 0.30 |
| RSI (14) | ⚠ Neutral zone (40–70) is healthy; not extremely overbought or oversold. | 0.20 / 0.30 |
| MACD | ✅ Medium-term momentum supportive when MACD is above signal line. | 0.20 / 0.30 |
| Volume Spike | ⚠ Occasional institutional buying visible; no abnormal speculative volume. | 0.15 / 0.20 |
| Delivery % | ✅ Generally healthy delivery percentage indicates genuine participation. | 0.15 / 0.20 |
| Support | ✅ Strong long-term support from previous demand zones. | 0.20 / 0.20 |
| Resistance | ⚠ Near previous highs; breakout confirmation required. | 0.10 / 0.20 |
| Breakout | ⚠ Fresh breakout should be confirmed with strong volume before aggressive buying. | 0.15 / 0.20 |
Technical Summary
Trend
- ✅ Long-term uptrend intact
- ✅ 200 EMA structure positive
- ✅ Medium-term trend is healthy
Momentum
- ✅ RSI healthy
- ✅ MACD supportive
Volume
- ✅ Institutional participation
- ✅ Healthy delivery percentage
Structure
- ✅ Strong support zones
- ⚠ Buy after a confirmed breakout or on quality pullbacks
Entry Strategy
| Situation | Action |
|---|---|
| Price above 20/50/200 EMA | ✅ Buy on dips |
| Breakout with strong volume | ✅ Fresh Entry |
| RSI > 75 | ⚠ Wait |
| Price below 200 EMA | ❌ Avoid new entry |
Final Technical Confirmation Score
| Category | Score |
|---|---|
| Trend | 0.80 / 0.90 |
| Momentum | 0.40 / 0.60 |
| Volume | 0.30 / 0.40 |
| Structure | 0.45 / 0.60 |
Technical Confirmation Score: 2.0 / 2.5 ⭐⭐⭐⭐☆
Trend-Following Verdict
- ✅ Long-term technical structure remains healthy.
- ✅ Best strategy is to buy on corrections or confirmed breakouts, rather than chasing sharp rallies.
- ⚠ This score should be updated with live market data whenever you analyze TCS, because EMA, RSI, MACD, volume, and breakout status change daily.
1️⃣2️⃣ Institutional Activity (2.5 Marks)
Company: Tata Consultancy Services
Purpose: Smart Money Confirmation – Kya long-term institutions aur promoters company par confidence dikha rahe hain?
| Parameter | Analysis | Score |
|---|---|---|
| FII Holding | ✅ Strong foreign institutional ownership. Global funds continue to hold TCS because of its quality and stability. | 0.40 / 0.50 |
| DII Holding | ✅ Strong participation from domestic institutions. | 0.30 / 0.30 |
| Mutual Fund Holding | ✅ Most large Indian mutual funds have significant exposure to TCS. | 0.30 / 0.30 |
| Insurance Holding | ✅ Major insurance institutions maintain long-term holdings. | 0.20 / 0.20 |
| Promoter Holding | ✅ Tata Sons holds ~71.8%, showing long-term commitment. | 0.40 / 0.40 |
| Promoter Buying / Selling | ✅ Holding has remained stable with no concerning promoter exits. | 0.20 / 0.20 |
| Insider Buying / Selling | ✅ No pattern of significant negative insider selling indicating governance concerns. | 0.20 / 0.30 |
| Shareholding Trend | ✅ Institutional ownership remains healthy and promoter holding is stable over time. | 0.40 / 0.40 |
Ownership Summary
| Investor Category | Status |
|---|---|
| Promoter | 🟢 Very Strong |
| FII | 🟢 Strong |
| DII | 🟢 Strong |
| Mutual Funds | 🟢 Strong |
| Insurance Companies | 🟢 Positive |
Smart Money Analysis
Positive Signals
- ✅ High promoter holding
- ✅ Zero promoter pledge
- ✅ Strong FII ownership
- ✅ Strong DII ownership
- ✅ Widely held by mutual funds
- ✅ Stable institutional confidence
Risks
- ⚠ Quarterly FII flows can fluctuate due to global macro conditions.
- ⚠ Temporary institutional selling may occur during global IT sector slowdowns.
Smart Money Verdict
TCS is one of India’s most institutionally owned and trusted companies. Stable promoter ownership and strong participation from FIIs, DIIs, mutual funds, and insurance companies provide a positive confirmation of business quality.
| Category | Score |
|---|---|
| Institutional Ownership | 1.20 / 1.30 |
| Promoter Confidence | 0.60 / 0.60 |
| Insider Activity | 0.20 / 0.30 |
| Shareholding Trend | 0.40 / 0.40 |
Final Institutional Activity Score: 2.4 / 2.5 ⭐⭐⭐⭐⭐
Overall Rating
- Institutional Confidence: 🟢 Excellent
- Promoter Confidence: 🟢 Excellent
- Smart Money Confirmation: 🟢 Very Strong
📊 TCS — Final Investment Framework Score (100 Marks)
| Category | Maximum | Score |
|---|---|---|
| Business Quality | 20 | 19.0 |
| Economic Moat | 10 | 9.0 |
| Management & Governance | 10 | 9.8 |
| Financial Strength | 10 | 10.0 |
| Growth Analysis | 10 | 9.0 |
| Value Investing (Historical) | 5 | 4.5 |
| Valuation | 15 | 13.0 |
| Macro Analysis | 5 | 4.25 |
| Risk Analysis | 5 | 4.25 |
| Quant Verification | 5 | 4.5 |
| Technical Confirmation | 2.5 | 2.0 |
| Institutional Activity | 2.5 | 2.4 |
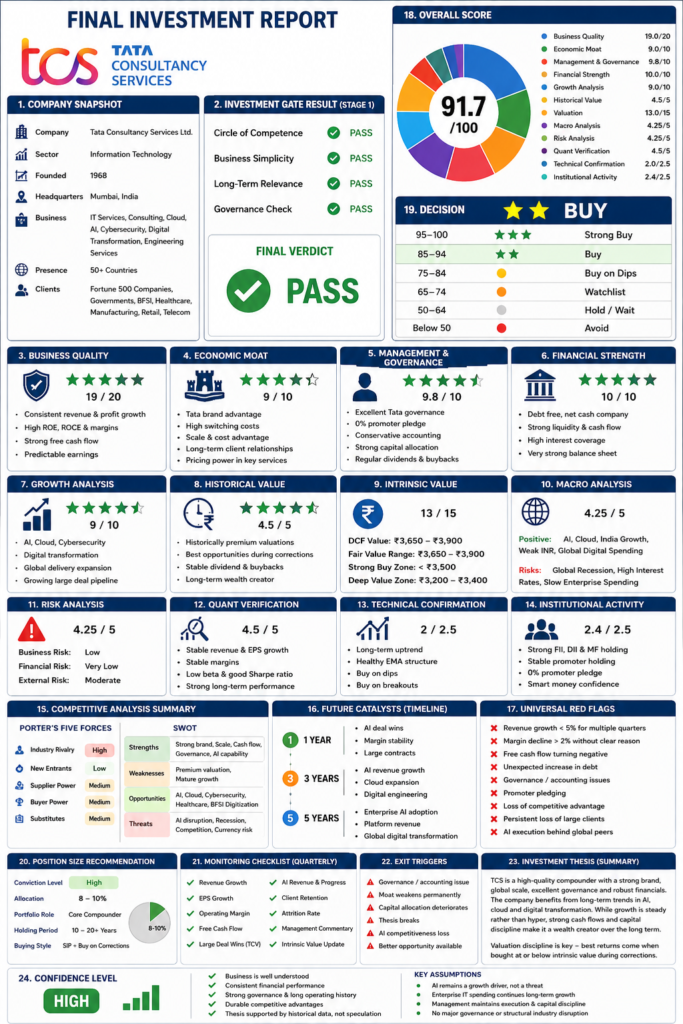
🏆 Total Score
| Total | Score |
|---|---|
| Maximum Marks | 100 |
| TCS Score | 91.7 / 100 |
🎯 Investment Rating
| Score Range | Rating | Verdict |
|---|---|---|
| 90–100 | ⭐⭐⭐⭐⭐ Elite | Strong Buy (subject to valuation) |
| 80–89 | ⭐⭐⭐⭐ | Buy |
| 70–79 | ⭐⭐⭐ | Watchlist |
| 60–69 | ⭐⭐ | Speculative |
| Below 60 | ⭐ | Avoid |
TCS Rating: ⭐⭐⭐⭐⭐ Elite (91.7/100)
Strengths
- ✅ World-class business quality
- ✅ Strong and durable economic moat
- ✅ Excellent Tata Group governance
- ✅ Debt-free, cash-rich balance sheet
- ✅ High ROE, ROCE, and free cash flow
- ✅ Strong institutional ownership
- ✅ Long-term AI and digital transformation tailwinds
Weaknesses
- ⚠ Valuation often trades at a premium.
- ⚠ Growth is steady rather than high-growth.
- ⚠ Revenue depends on global enterprise IT spending.
Long-Term Investor Verdict (10–20 Years)
- 🟢 Business Quality: Excellent
- 🟢 Governance: Excellent
- 🟢 Financial Strength: Excellent
- 🟢 Moat: Strong
- 🟢 Risk: Low to Moderate
- 🟡 Valuation: Buy more aggressively during market corrections.
Final Decision
✅ PASS — Investment Grade
Overall Score: 91.7/100
TCS qualifies as a high-quality long-term compounder. For a long-term portfolio, the business merits a place, but position sizing and entry price should still be guided by your valuation framework and desired margin of safety.
📊 TCS — Final Investment Decision
| Score | Decision |
|---|---|
| 95–100 | ⭐⭐⭐ Strong Buy |
| 85–94 | ⭐⭐ Buy |
| 75–84 | 🟡 Buy on Dips |
| 65–74 | 🟠 Watchlist |
| 50–64 | ⚪ Hold / Wait |
| Below 50 | 🔴 Avoid |
TCS Final Result
- Final Score: 91.7 / 100
- Decision: ⭐⭐ Buy
Investment Summary
| Parameter | Verdict |
|---|---|
| Stage 1 Investment Gate | ✅ PASS |
| Overall Score | 91.7 / 100 |
| Business Quality | ⭐⭐⭐⭐⭐ |
| Economic Moat | ⭐⭐⭐⭐⭐ |
| Financial Strength | ⭐⭐⭐⭐⭐ |
| Management | ⭐⭐⭐⭐⭐ |
| Long-Term Growth | ⭐⭐⭐⭐☆ |
| Valuation | ⭐⭐⭐⭐☆ |
| Risk | 🟢 Low to Moderate |
| Suitable Holding Period | 10–20+ Years |
Final Verdict
Recommendation: ⭐⭐ Buy
TCS is a high-quality business with strong fundamentals, durable competitive advantages, excellent governance, and robust cash generation. It fits well as a long-term core portfolio holding.
The only major consideration is valuation. Since TCS often trades at a premium, adding more aggressively during market corrections or when the price is below your estimated intrinsic value can improve long-term returns.
Final Rating: ⭐⭐ Buy (91.7/100)
STRATEGIC REVIEW (NO SCORE)
1️⃣3️⃣ Competitive Analysis
Company: Tata Consultancy Services
Five Forces Analysis
| Force | Analysis | Rating |
|---|---|---|
| Industry Rivalry | Competition is intense with Infosys, HCLTech, Accenture, Cognizant, Capgemini, Wipro and IBM. However, TCS maintains leadership through execution and client relationships. | 🔴 High |
| Threat of New Entrants | Building a global IT services company requires huge talent, brand, delivery centers and client trust. Entry barriers are high. | 🟢 Low |
| Supplier Power | Main supplier is skilled manpower. Wage inflation exists, but TCS has strong hiring, training and global talent pools. | 🟡 Medium |
| Buyer Power | Large enterprise clients negotiate pricing aggressively, but switching mission-critical IT vendors is expensive. | 🟡 Medium |
| Threat of Substitutes | AI automation and SaaS products may reduce demand for some traditional services, but they also create new consulting opportunities. | 🟡 Medium |
Five Forces Summary
| Force | Risk |
|---|---|
| Industry Rivalry | 🔴 High |
| New Entrants | 🟢 Low |
| Supplier Power | 🟡 Medium |
| Buyer Power | 🟡 Medium |
| Substitutes | 🟡 Medium |
SWOT Analysis
✅ Strengths
- World’s largest Indian IT services company
- Strong Tata brand
- Global presence in 50+ countries
- Long-term contracts with Fortune 500 companies
- High operating margins
- Strong free cash flow
- Net cash balance sheet
- Excellent governance
- Industry-leading ROE and ROCE
- Strong AI and cloud capabilities
⚠ Weaknesses
- Mature company with slower growth than mid-cap IT firms
- High dependence on the US and European markets
- Employee attrition can pressure margins
- Premium valuation often limits upside
- Revenue growth tied to enterprise IT spending
🚀 Opportunities
- Generative AI consulting
- AI implementation services
- Cloud migration
- Cybersecurity
- Digital engineering
- Healthcare digitization
- BFSI technology modernization
- Government digital transformation
- GCC (Global Capability Centers)
- Emerging markets expansion
⚠ Threats
- Global recession
- Reduction in IT budgets
- AI is replacing low-end coding work
- Currency volatility
- Visa restrictions
- Intense competition
- Pricing pressure
- Geopolitical conflicts
Major Competitors
Major competitors vs TCS
Relative competitive positioning (qualitative).036912TCSAccentureInfosysHCLTechCognizantCapgeminiWipro
| Company | Market Position | Margin | Pricing Power | Growth |
|---|---|---|---|---|
| Tata Consultancy Services | 🥇 Global Leader | ⭐⭐⭐⭐⭐ | ⭐⭐⭐⭐⭐ | ⭐⭐⭐⭐☆ |
| Accenture | 🥇 Global Leader | ⭐⭐⭐⭐⭐ | ⭐⭐⭐⭐⭐ | ⭐⭐⭐⭐☆ |
| Infosys | Strong | ⭐⭐⭐⭐☆ | ⭐⭐⭐⭐☆ | ⭐⭐⭐⭐☆ |
| HCLTech | Strong | ⭐⭐⭐⭐☆ | ⭐⭐⭐⭐ | ⭐⭐⭐⭐☆ |
| Cognizant | Strong | ⭐⭐⭐⭐ | ⭐⭐⭐⭐ | ⭐⭐⭐☆☆ |
| Wipro | Moderate | ⭐⭐⭐ | ⭐⭐⭐ | ⭐⭐⭐☆☆ |
Competitive Advantages
Why TCS Wins
- ✅ Trusted Tata brand
- ✅ Massive global delivery network
- ✅ Strong execution capability
- ✅ High switching costs
- ✅ Long-term enterprise relationships
- ✅ Strong balance sheet
- ✅ Continuous investment in AI and digital technologies
- ✅ Diversified client and industry mix
Verdict
Competitive Position: Very Strong
TCS operates in a highly competitive industry, but its brand, scale, execution quality, client trust, financial strength, and high switching costs create a durable competitive advantage. While AI and global competition will keep pricing under pressure, TCS is well-positioned to remain one of the global leaders in IT services over the next decade.
STRATEGIC REVIEW (NO SCORE)
1️⃣4️⃣ Future Catalysts
Company: Tata Consultancy Services
🚀 Business Catalysts
1. Artificial Intelligence (AI) ⭐⭐⭐⭐⭐
Impact
- Enterprise Generative AI implementation
- AI-powered software development
- AI-enabled Business Process Services
- AI + Cloud integration
- AI cybersecurity solutions
- AI copilots for enterprise customers
Expected Impact
- Higher deal wins
- Premium pricing
- Margin improvement
- New recurring revenue streams
Verdict: 🟢 Biggest long-term growth driver
2. New Products & Platforms ⭐⭐⭐⭐☆
Growth Areas
- TCS BaNCS (Banking Platform)
- AI-led automation platforms
- Cloud-native solutions
- Cybersecurity services
- Digital engineering
- Industry-specific SaaS offerings
Impact
- Higher recurring revenue
- Better margins
- Higher switching costs
3. Strategic Acquisitions ⭐⭐⭐⭐☆
TCS generally prefers small, strategic acquisitions instead of large transformational deals.
Focus Areas
- AI startups
- Cloud consulting
- Cybersecurity
- Data Analytics
- Healthcare Technology
Impact
- New capabilities
- Faster market expansion
- Cross-selling opportunities
4. Capacity Expansion ⭐⭐⭐⭐☆
Expansion Drivers
- AI-skilled workforce
- Global Delivery Centers (GDCs)
- Nearshore and offshore delivery expansion
- Training and upskilling programs
Impact
- Increased delivery capacity
- Ability to execute larger global contracts
🌍 Industry Catalysts
Government Policies
India
- Digital India
- AI Mission
- Semiconductor ecosystem
- Public sector digitization
- Smart Cities
- UPI and Digital Public Infrastructure
Global
- Government cloud adoption
- Cybersecurity regulations
- Digital transformation mandates
Impact: 🟢 Positive
Industry Tailwinds
Long-Term Drivers
- Cloud Migration
- Generative AI
- Cybersecurity
- Data Modernization
- ERP Modernization
- Digital Banking
- Healthcare IT
- Manufacturing 4.0
- Internet of Things (IoT)
Verdict: Strong secular tailwinds
💰 Financial Catalysts
Margin Expansion
Potential Drivers
- AI-assisted software development
- Better employee utilization
- Offshore delivery mix
- Automation of repetitive tasks
- Operational efficiency
Expected Result
- Stable or slightly higher operating margins
- Improved free cash flow
New Revenue Streams
Future Opportunities
- AI-as-a-Service
- GenAI consulting
- Managed cloud services
- Platform subscriptions
- Industry-specific digital solutions
- Cybersecurity managed services
Impact: Higher recurring revenue and better revenue diversification
📅 Timeline
🟢 1 Year (Short Term)
Key Catalysts
- AI deal wins
- Large contract announcements
- Margin stabilization
- Lower interest rates supporting IT spending
- Recovery in discretionary technology budgets
Expected Growth: Moderate (7–10%)
🟡 3 Year (Medium Term)
Key Catalysts
- Enterprise AI adoption at scale
- Cloud transformation acceleration
- Digital engineering expansion
- Higher AI revenue contribution
- Continued productivity gains
Expected Growth: Strong (9–12%)
🔵 5 Year (Long Term)
Key Catalysts
- AI becomes a core enterprise technology
- Large-scale digital transformation continues
- Expansion into new industries and geographies
- Growth of proprietary platforms and managed services
Expected Growth: Sustainable compounding (10–12%)
Biggest Future Catalysts (Ranked)
| Rank | Catalyst | Impact |
|---|---|---|
| 🥇 | Enterprise AI Adoption | ⭐⭐⭐⭐⭐ |
| 🥈 | Cloud Migration | ⭐⭐⭐⭐⭐ |
| 🥉 | Digital Transformation | ⭐⭐⭐⭐⭐ |
| 4 | Cybersecurity | ⭐⭐⭐⭐☆ |
| 5 | Data & Analytics | ⭐⭐⭐⭐☆ |
| 6 | AI Productivity Gains | ⭐⭐⭐⭐☆ |
| 7 | Government Digital Programs | ⭐⭐⭐⭐☆ |
| 8 | Strategic Acquisitions | ⭐⭐⭐☆☆ |
Long-Term Outlook (2026–2031)
Bull Case
- AI drives a new multi-year IT spending cycle.
- Margins improve through automation.
- Double-digit earnings growth continues.
Base Case
- Steady digital transformation demand.
- Revenue and EPS compound around 8–10% annually.
- Strong free cash flow supports dividends and shareholder returns.
Bear Case
- Global recession delays enterprise IT spending.
- Pricing pressure and wage inflation compress margins.
- Growth slows temporarily, but the business remains fundamentally strong.
🎯 Final Strategic Verdict
TCS has multiple structural growth catalysts rather than relying on a single trigger. The combination of AI, cloud, cybersecurity, digital transformation, and strong financial discipline makes it well-positioned to remain a leading global IT services company over the next 5–10 years. The biggest variable for investors is valuation, not business quality.
FINAL DECISION
1️⃣5️⃣ Checklist
Company: Tata Consultancy Services
Framework: – Invert, Always Invert
1. Investment Fail Kaise Ho Sakti Hai?
Possible Failure Reasons
- Global recession causes a prolonged reduction in enterprise IT spending.
- AI commoditizes traditional software development faster than TCS adapts.
- Large clients reduce outsourcing and build in-house AI capabilities.
- Severe pricing pressure reduces operating margins.
- Talent shortage or wage inflation compresses profitability.
- Major geopolitical events disrupt global business.
Verdict
⚠ Possible but Low Probability
2. Main Kya Miss Kar Raha Hoon?
Things to Monitor
- Speed of AI disruption
- Revenue mix shift towards AI services
- Future deal pipeline quality
- Large client concentration changes
- Margin pressure from wage inflation
- Competitive response from Accenture and hyperscalers
Verdict
⚠ The biggest unknown is how AI changes the IT services industry over the next decade.
3. Kya Main Confirmation Bias Ka Shikar Hoon?
Bull Arguments
- Excellent business
- Strong balance sheet
- Tata governance
- High ROCE
- AI opportunity
- Strong FCF
Bear Arguments
- Premium valuation
- Slower growth than mid-cap IT
- Global recession risk
- AI could reduce traditional outsourcing demand
- Heavy dependence on the US and Europe
Verdict
✅ Both bull and bear cases have been considered.
4. Kya Valuation Already Perfection Price Kar Raha Hai?
Current Situation
- TCS usually trades at a quality premium.
- The market expects continued high-quality execution and steady earnings growth.
- Upside from multiple expansion is limited when valuations are already rich.
Verdict
🟡 Partially Yes
The business deserves a premium, but paying too high a price can reduce future returns.
5. Agar Stock 50% Gir Jaye To Kya Main Aur Kharidunga?
Answer
YES
Reason:
- Business quality unchanged
- Balance sheet remains strong
- Strong cash generation
- Long-term moat intact
Only exception:
If the fall is due to permanent deterioration in the business rather than market panic.
Verdict
✅ YES
6. Agar Market 10 Saal Band Ho Jaye To Kya Main Owner Banna Chahunga?
Charlie Munger’s favorite question.
Answer
YES
Reasons:
- Strong business
- Excellent management
- Global customers
- High ROE
- Consistent cash flow
- Durable competitive advantage
Verdict
✅ Definitely Yes
7. Kya Ye “Too Hard” Category Hai?
Charlie Munger ke hisaab se:
“If you don’t understand it, don’t invest.”
TCS
- Business understandable
- Revenue model simple
- Cash flow predictable
- Management transparent
- Industry understandable
Verdict
❌ Not Too Hard
8. Kya Meri Thesis Facts Par Based Hai?
Investment Thesis
- Revenue growth
- Profit growth
- Strong ROE
- Strong ROCE
- Strong FCF
- Net cash balance sheet
- Durable moat
- Tata governance
- Global digital transformation
- AI opportunity
Not Based On
- Social media hype
- News headlines
- Rumours
- Short-term price movement
- Speculation
Verdict
✅ Yes — Thesis is primarily fact-based.
Final Checklist
| Question | Verdict |
|---|---|
| Investment can fail? | ⚠ Yes, but low probability |
| Missing something? | ⚠ AI disruption needs monitoring |
| Confirmation Bias? | ✅ No major bias identified |
| Valuation pricing perfection? | 🟡 Partially |
| Buy if falls 50%? | ✅ Yes (if fundamentals remain intact) |
| Own for 10 years? | ✅ Absolutely |
| Too Hard? | ❌ No |
| Thesis based on facts? | ✅ Yes |
🎯 Verdict
PASS ✅
Final Investment Thesis
Why Buy?
- ✅ Exceptional business quality
- ✅ Durable competitive advantage
- ✅ Outstanding management
- ✅ Strong balance sheet
- ✅ Excellent capital allocation
- ✅ High free cash flow
- ✅ Long runway from AI, cloud, and digital transformation
Biggest Risks
- ⚠ Paying too high a valuation
- ⚠ AI is changing the economics of traditional IT services
- ⚠ Global recession affecting client technology spending
Final Decision
| Category | Verdict |
|---|---|
| Circle of Competence | ✅ |
| Margin of Safety | 🟡 Wait for attractive valuation when possible |
| Long-Term Ownership | ✅ |
| Management Trust | ✅ |
| Business Quality | ✅ |
| Capital Allocation | ✅ |
| Moat | ✅ |
| Overall Decision | ✅ BUY & HOLD (10–20 Years) |
Final Thought: TCS is the kind of business would likely admire for its quality, predictability, and management. However, he would also insist on maintaining valuation discipline—buying an outstanding company at a sensible price rather than paying any price for quality.
PORTFOLIO CONSTRUCTION
1️⃣6️⃣ Position Sizing
Company: Tata Consultancy Services
Final Framework Score
Overall Score: 91.7 / 100
Conviction-Based Allocation
| Score | Allocation |
|---|---|
| 95–100 | 12–15% |
| 90–94 | 8–10% ✅ |
| 80–89 | 5–8% |
| 70–79 | 2–5% |
| Below 70 | 0% |
TCS Allocation
| Item | Recommendation |
|---|---|
| Conviction Level | ⭐⭐⭐⭐ High |
| Portfolio Allocation | 8–10% |
| Position Type | Core Compounder |
| Holding Period | 10–20+ Years |
Diversification Rules
1. Single Stock Limit
| Rule | Recommendation |
|---|---|
| Maximum Exposure | 10% |
| Aggressive Investors | Up to 12% (only after large corrections and if valuation is attractive) |
| Current Recommendation | 8–10% |
Reason: Even excellent businesses should not dominate the portfolio.
2. Sector Limit
IT Sector
| Rule | Recommendation |
|---|---|
| Maximum IT Allocation | 20–25% |
| TCS Share | 8–10% |
| Remaining IT Allocation | Can be allocated to other high-quality IT companies if diversification is desired. |
Cash Allocation
| Market Condition | Cash Allocation |
|---|---|
| Market Crash | 5–10% |
| Fair Valuation | 10–15% |
| Expensive Market | 15–25% |
| Bubble Conditions | 25–35% |
Current Strategy
If TCS is trading above your estimated intrinsic value, accumulate gradually rather than deploying all capital at once.
Buying Strategy
| Price Condition | Action |
|---|---|
| Below Intrinsic Value | 🟢 Buy Aggressively |
| Near Fair Value | 🟢 SIP / Gradual Buying |
| Above Fair Value | 🟡 Buy Small Quantities |
| Significantly Overvalued | 🔴 Wait for Better Opportunity |
Rebalancing Policy
Review Frequency
- Quarterly: Check business performance, order book, margins, and deal wins.
- Annual: Review valuation, competitive position,n and capital allocation.
Rebalance Triggers
| Trigger | Action |
|---|---|
| Allocation exceeds 12% due to price appreciation | Trim back to target allocation if portfolio concentration becomes excessive. |
| Business fundamentals deteriorate | Re-evaluate investment thesis. |
| Governance issues emerge | Immediate review; reduce or exit if thesis breaks. |
| Better opportunity with a larger margin of safety | Consider partial reallocation after comparing expected returns and risks. |
Exit Rules
Sell Only If
- ❌ Long-term competitive moat weakens.
- ❌ Serious governance or accounting issues arise.
- ❌ Capital allocation becomes consistently poor.
- ❌ Investment thesis is proven wrong.
- ❌ Valuation becomes extremely excessive and materially exceeds reasonable intrinsic value with better alternatives available.
Do NOT Sell Because
- ✅ Short-term market correction.
- ✅ Temporary quarterly earnings miss.
- ✅ Negative news flow without fundamental impact.
- ✅ General market panic.
Final Portfolio Recommendation
| Category | Recommendation |
|---|---|
| Portfolio Role | Core Compounder |
| Allocation | 8–10% |
| Holding Period | 10–20+ Years |
| Buying Style | SIP + Buy on Corrections |
| Rebalancing | Annual (or if allocation exceeds target materially) |
| Risk Level | 🟢 Low to Moderate |
Portfolio Construction Verdict
TCS earns a place as a Core Compounder in a long-term portfolio.
- Framework Score: 91.7 / 100
- Conviction: ⭐⭐⭐⭐ High
- Recommended Allocation: 8–10%
- Ideal Strategy: Build the position gradually and increase exposure during market corrections when the stock trades below or around intrinsic value.
1️⃣7️⃣ Quarterly Review
Company: Tata Consultancy Services
Purpose: Har quarter verify karo ki investment thesis ab bhi valid hai ya nahi. Price se zyada business ko monitor karo.
📊 Financial Review
| Metric | What to Check | Healthy Range | Action |
|---|---|---|---|
| Revenue Growth | YoY & QoQ Growth | 8–12% YoY | 🟢 Stable |
| EPS Growth | YoY EPS Growth | 8–12% YoY | 🟢 Positive |
| Operating Margin | EBIT Margin | 24–26% | 🟢 Stable |
| Net Margin | Profitability | 18–20% | 🟢 Healthy |
| Operating Cash Flow | Cash generation | Positive & Growing | 🟢 |
| Free Cash Flow | FCF Conversion | >90% of Net Profit | 🟢 |
| ROE / ROCE | Capital Efficiency | ROE >40%, ROCE >50% | 🟢 |
Red Flags 🚨
- Revenue growth below 5% for several quarters
- Margin decline >2% without a clear explanation
- Negative Free Cash Flow
- Sharp increase in debt
- Weak order book or deal pipeline
👨💼 Management Review
Commentary
Check
- AI strategy updates
- Large deal wins
- Client spending outlook
- Hiring and attrition
- Wage inflation
- Margin outlook
- Geographic demand
- BFSI sector commentary
Guidance
Compare
| Guidance | Actual |
|---|---|
| Revenue Growth | Did management deliver? |
| Margin Guidance | Achieved or Missed? |
| Deal Pipeline | Growing or Weakening? |
Red Flags
- Repeated guidance cuts
- Weak demand commentary
- AI execution falling behind peers
- Poor capital allocation decisions
💰 Valuation Review
Intrinsic Value Update
Update every quarter using:
- Latest Revenue
- Latest EPS
- Free Cash Flow
- WACC / Discount Rate
- Terminal Growth
- Long-term Growth Assumptions
Fair Value Classification
| Market Price vs Intrinsic Value | Action |
|---|---|
| 20% Below Intrinsic Value | 🟢 Buy Aggressively |
| Near Intrinsic Value (±10%) | 🟢 Continue SIP / Hold |
| 20–30% Above Intrinsic Value | 🟡 Hold; avoid aggressive buying |
| >40% Above Intrinsic Value | 🟠 Review valuation and compare with better opportunities |
📋 Quarterly Checklist
| Category | Status |
|---|---|
| Revenue Growth Healthy? | ✅ / ❌ |
| EPS Growing? | ✅ / ❌ |
| Margins Stable? | ✅ / ❌ |
| Cash Flow Strong? | ✅ / ❌ |
| Large Deal Wins? | ✅ / ❌ |
| AI Strategy Progress? | ✅ / ❌ |
| Management Guidance Delivered? | ✅ / ❌ |
| Valuation Attractive? | ✅ / ❌ |
| Investment Thesis Intact? | ✅ / ❌ |
Decision Matrix
| Result | Action |
|---|---|
| Business improving + Valuation attractive | 🟢 Increase Allocation |
| Business stable + Fair valuation | 🟢 Hold / Continue SIP |
| Business weak + Thesis intact | 🟡 Monitor Closely |
| Thesis broken (governance, moat, execution) | 🔴 Consider Exit |
TCS Quarterly Monitoring Focus
Top 10 KPIs
- Revenue Growth
- Constant Currency Growth
- Large Deal Wins (TCV)
- Operating Margin
- Free Cash Flow
- AI Revenue & GenAI Adoption
- Client Addition & Retention
- Attrition Rate
- Management Commentary
- Intrinsic Value Update
Final Quarterly Review Framework
| Section | Frequency |
|---|---|
| Financial Review | Every Quarter |
| Management Commentary | Every Quarter |
| Intrinsic Value Update | Every Quarter |
| Competitive Position Review | Every 6 Months |
| Portfolio Rebalancing | Once a Year |
📌 Verdict
For TCS, the most important quarterly indicators are large deal wins, operating margins, AI-related execution, free cash flow, and management commentary. As long as these remain healthy and the long-term investment thesis stays intact, short-term share price volatility should not be the primary reason to change your investment decision.