
The Indian stock market is entering a critical phase.
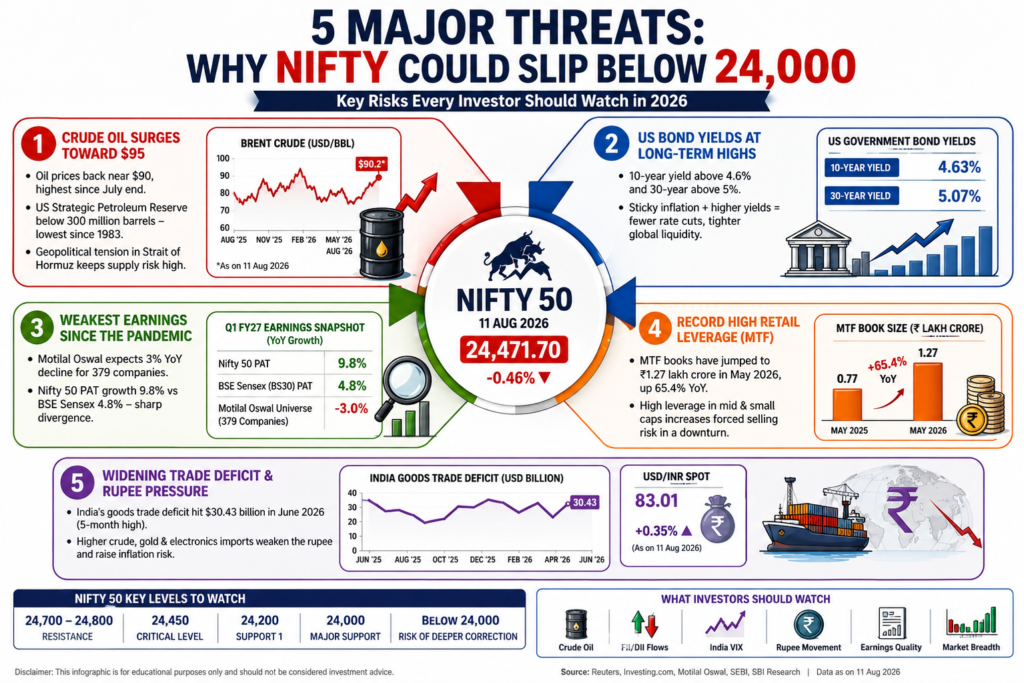
After months of strong momentum, the Nifty 50 is showing signs of increasing pressure. On August 11, 2026, the index fell 0.46% to 24,471.70, while the Sensex declined 0.49% to 78,154.25. Rising crude oil prices, a weaker rupee and concerns about global interest rates have all started to weigh on investor sentiment.
More importantly, Nifty slipped below the widely watched 24,450 technical zone during the session. That makes the 24,000 level increasingly important for investors and traders.
The big question is:
Is the current weakness simply a temporary correction—or is the Indian market entering a deeper risk-off phase?
Here are five warning signs investors should monitor closely.
1. Crude Oil Is Becoming a Major Risk for India
The first major warning sign is crude oil.
Oil prices have moved back toward the $90-per-barrel area, with geopolitical uncertainty surrounding the Middle East adding to supply concerns. Reuters reported that crude reached around $90 on August 11, its highest level since the end of July.
For India, this matters enormously.
India is one of the world’s largest oil importers. When crude rises sharply:
- India’s import bill increases
- Inflationary pressure can return
- The rupee can weaken
- Corporate margins can come under pressure
- The current-account balance can deteriorate
- Government finances can face additional pressure
This is why crude oil is effectively a macro tax on the Indian economy.
The key oil levels
Investors should monitor:
$80 → $90 → $100
A sustained move above $90 would become significantly more uncomfortable for Indian equities, particularly if the rupee simultaneously weakens.
The market does not necessarily need $100 oil to become bearish. A prolonged period around $90–95 could itself be enough to pressure margins and inflation expectations.
2. The Interest-Rate Story Is Becoming Less Friendly
For a long time, investors were positioned around the expectation that global interest rates would eventually fall.
But the market environment has become more complicated.
Higher oil prices can make inflation stickier. If inflation remains elevated, central banks have less flexibility to cut rates aggressively.
That creates a difficult combination:
Higher oil + sticky inflation + higher bond yields = tighter financial conditions
This matters because equity valuations are highly sensitive to interest rates.
When bond yields rise, investors can demand higher returns from equities. If earnings do not increase quickly enough, valuation multiples can contract.
Why this matters for Nifty
Imagine a company earning ₹100 per share.
At a P/E of 20:
₹100 × 20 = ₹2,000
But if investors become more risk-averse and the acceptable P/E falls to 17:
₹100 × 17 = ₹1,700
The company’s earnings haven’t changed—but its valuation falls by 15%.
That is why investors should watch earnings growth and valuation together, rather than looking only at index price.
3. Earnings Growth May Be More Important Than Headline Profits
The third warning sign is the quality of earnings.
This requires some nuance.
It would be incorrect to say that every Indian company is experiencing an earnings collapse. Some companies have delivered strong Q1 FY27 results. For example, Hero MotoCorp reported a 29% YoY rise in standalone net profit to ₹1,454 crore, while LIC reported a 23% YoY increase in standalone profit.
However, the broader earnings picture is mixed.
Motilal Oswal’s July 2026 outlook projected approximately 10% earnings growth for the Nifty, while its broader coverage universe was expected to see a 3% YoY decline—the weakest performance since September 2020.
This creates an important divergence:
Nifty earnings can remain relatively strong while the broader corporate earnings environment becomes weaker.
Investors therefore need to look beyond headline PAT.
Watch these five earnings indicators
- Revenue growth
- EBITDA margin
- Operating cash flow
- EPS growth
- Free cash flow
If profit rises but revenue and operating cash flow remain weak, investors should investigate the quality of that earnings growth.
4. Retail Leverage Is Rising
One of the most interesting structural risks is the growth of leveraged retail participation.
India’s Margin Trading Facility, or MTF, book has expanded dramatically.
Recent reports put India’s MTF book at approximately ₹1.27 lakh crore in May 2026, up around 65.4% YoY. Other estimates have put the figure above ₹1.3 lakh crore.
That is a significant increase.
However, investors should not automatically interpret rising MTF as evidence of an imminent crash.
The Economic Times notes that India’s MTF framework has important safeguards, including margin monitoring and regulatory controls.
The real risk appears when leverage rises at the same time as volatility and falling liquidity.
Why leverage can amplify a correction
Suppose an investor buys ₹10 lakh worth of shares using:
- ₹5 lakh of own capital
- ₹5 lakh borrowed money
If the portfolio falls 10%, the position loses ₹1 lakh.
That represents:
20% loss on the investor’s ₹5 lakh equity
A deeper fall can therefore produce forced selling, additional margin requirements and a feedback loop.
This is why MTF should be treated as a risk amplifier, not necessarily as proof that a market crash is coming.
SEBI itself published a consultation paper in June 2026 proposing changes to the MTF framework, highlighting the importance of monitoring this area.
5. India’s Trade Deficit and Rupee Risk Are Back in Focus
The fifth warning sign is India’s external balance.
India’s goods trade deficit widened sharply to approximately $30.43 billion in June 2026, compared with $19.12 billion in the corresponding period a year earlier. Imports rose 31% to $70.84 billion.
April was also concerning, with the merchandise trade deficit around $28.4 billion, according to Reuters.
Why does this matter for equities?
Because India imports large quantities of:
- Crude oil
- Gold
- Electronics
- Machinery
- Industrial components
When import costs rise, the rupee can come under pressure.
And a weaker rupee can create another problem:
Imported inflation.
The combination investors should monitor is:
Crude ↑ + Trade deficit ↑ + Rupee ↓
If all three move together, the macroeconomic environment becomes considerably less comfortable.
So, Is the Nifty 24,000 Floor About to Crack?
This is where technical analysis becomes important.
On August 11, Nifty closed at:
24,471.70
The index has already been testing the 24,450 zone, which many traders are watching as a near-term technical line.
The important levels can therefore be framed as:
| Nifty Level | Market Significance |
|---|---|
| 24,700–24,800 | Near-term recovery zone |
| 24,450 | Important technical pivot |
| 24,200 | First downside support |
| 24,000 | Major psychological support |
| Below 24,000 | Risk of deeper correction increases |
A single intraday move below 24,450 should not automatically be interpreted as a confirmed bear-market signal.
The stronger confirmation would be:
Daily close below 24,450 + rising volatility + weak breadth + FII selling + sustained crude above $90
That combination would be considerably more bearish than price alone.
The 24,000 Level Is Psychological—Not Magical
Investors should remember that 24,000 is a round-number psychological support, not an economic law.
If Nifty breaks 24,000, the market does not automatically become a crash market.
Instead, investors should ask:
What happens after the breakdown?
If Nifty falls below 24,000 but quickly recovers, it could represent a false breakdown.
But if Nifty:
- closes below 24,000,
- remains below it for several sessions,
- sees rising India VIX,
- experiences weak market breadth,
- sees persistent FII selling,
- and faces higher crude prices,
then the breakdown becomes much more meaningful.
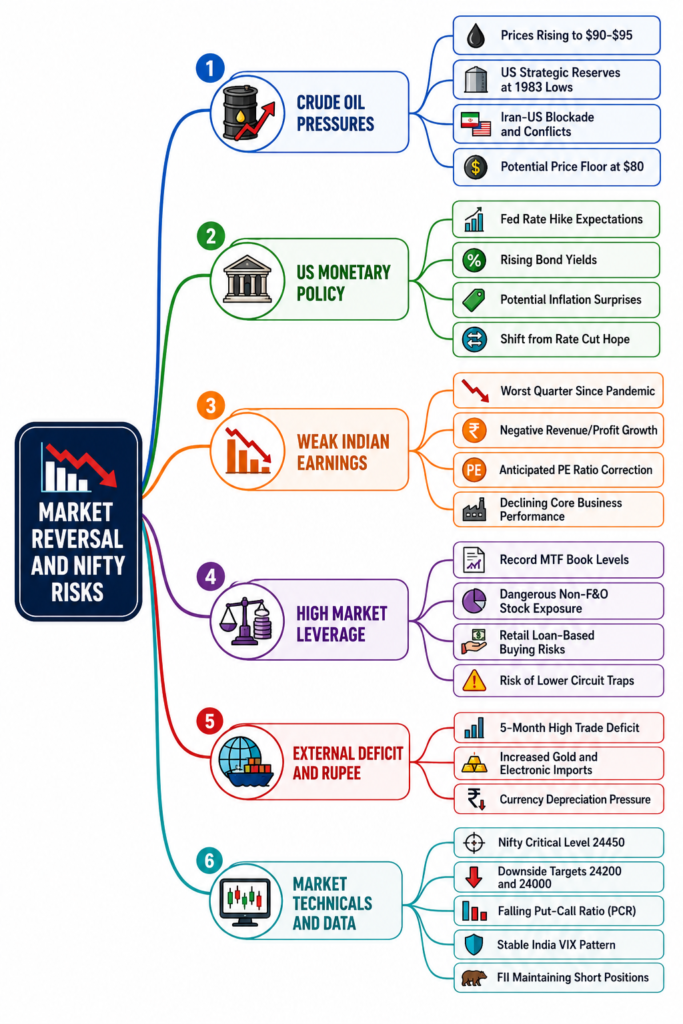
The 5 Warning Signs at a Glance
1. Crude Oil
Risk: Oil sustaining above $90–95
2. Interest Rates
Risk: Sticky inflation and higher bond yields reducing liquidity
3. Earnings
Risk: Weak revenue and operating growth despite headline profit numbers
4. Retail Leverage
Risk: Rapid MTF expansion increasing forced-selling sensitivity
5. Trade Deficit & Rupee
Risk: Higher import costs weakening the rupee and increasing inflation pressure
What Investors Should Watch Now
Instead of trying to predict the exact bottom, investors should build a dashboard of leading indicators.
Nifty 50
24,450 → 24,200 → 24,000
Crude Oil
$90 → $95 → $100
India VIX
Watch for a sustained volatility expansion rather than a one-day spike.
FII Flow
Persistent foreign selling can amplify downside pressure.
DII Flow
Strong domestic institutional buying can help absorb foreign outflows.
Earnings
Focus on EPS + revenue + margins + cash flow, not PAT alone.
Rupee
A sharp depreciation combined with higher crude would be a particularly negative combination.
Market Breadth
If Nifty remains stable while small- and mid-cap stocks experience widespread declines, investors should not assume that the market is healthy.
Bull Case vs Bear Case
The market does not have to follow the bearish scenario.
Bull Case
The bearish thesis could weaken if:
- Crude retreats below $85
- Geopolitical tensions ease
- The rupee stabilizes
- Global bond yields decline
- Earnings upgrades accelerate
- FII flows improve
- Nifty reclaims 24,450 and then 24,700–24,800
Under that scenario, the current decline could simply be a healthy correction.
Bear Case
The downside risk increases if:
- Crude remains above $90
- Rupee weakness accelerates
- Global yields rise
- Earnings estimates are downgraded
- FII selling intensifies
- India VIX rises sharply
- Nifty closes decisively below 24,450
- 24,000 breaks on a sustained closing basis
That would increase the probability of a deeper correction.
Final Verdict: Don’t Panic—Watch the Confirmation
The biggest mistake investors can make right now is to treat one support level as a guaranteed market bottom.
The 24,000 Nifty level is important, but the real story is the combination of macroeconomic and market signals.
Crude oil is already around $90, the June trade deficit reached roughly $30.4 billion, and MTF leverage has climbed to around ₹1.27 lakh crore. At the same time, earnings remain mixed rather than universally weak.
Therefore, the correct question is not:
“Will Nifty crash below 24,000?”
The better question is:
“Will multiple warning signals confirm the breakdown at the same time?”
For investors, the key dashboard is now:
Crude Oil + Rupee + FII/DII Flows + India VIX + Earnings + Market Breadth + Nifty 24,450/24,000
If these indicators deteriorate together, risk management becomes more important than chasing every dip.
Because in a leveraged market, the difference between buying the dip and catching a falling knife is confirmation.
Investor Disclaimer
This article is for educational and informational purposes only. It does not constitute investment advice, a recommendation to buy or sell any security, or a guarantee of future market performance. Market conditions can change rapidly, and investors should conduct their own research and consider their risk tolerance before making investment decisions.
alternate titles
- Nifty 24,000 Support at Risk? 5 Warning Signs Indian Investors Cannot Ignore
- Nifty 50 Crash Alert? 5 Signals That Could Push the Index Below 24,000
- Nifty 24,000 Breakdown: 5 Major Risks Investors Should Watch in 2026
- Is Nifty Heading Below 24,000? Crude, FII Selling, Earnings & Leverage Explained
- Nifty 50 Outlook 2026: 5 Warning Signs Before the 24,000 Support Breaks