

The US 10-Year Treasury yield is no longer just a bond-market statistic. It is one of the most important prices in the global financial system.
While retail investors obsess over individual stock charts, option chains and the latest cryptocurrency narrative, institutional investors are watching something far more powerful: the cost of money itself.
That number is the US 10-Year Treasury yield.
And in September 2026, the warning light is flashing.
The 10-year Treasury yield has moved toward the 5% threshold, reaching roughly the 4.8% area in early September. Reuters notes that the bond market is experiencing a significant sell-off, with higher yields increasingly competing with expensive equities and raising corporate financing costs.
Why does this matter to an investor in India?
Because the same yield that determines how attractive a US government bond looks to a pension fund in New York can influence:
- Nifty valuations
- Nasdaq and AI stocks
- Gold prices
- Bitcoin
- FII flows
- the Indian rupee
- corporate borrowing costs
- emerging-market interest rates
Think of the US 10-Year yield as the remote control of global asset pricing.
1. The $32 Trillion Machine Behind the Yield
The US Treasury market is enormous.
The marketable Treasury debt—the portion actively traded in financial markets—has reached roughly $31.5 trillion.
But there is an important distinction investors should understand:
$31.5 trillion is not the same thing as total US federal debt.
Total US national debt has now crossed the $40 trillion level, while marketable Treasury securities represent the portion primarily used by investors and financial institutions.
This distinction matters because the Treasury must continually refinance a huge amount of outstanding debt.
And when the government needs to borrow at enormous scale, the bond market—not Washington alone—determines the price.
That price is expressed through the yield.
The simple equation:
Higher Treasury demand → lower yields
Lower Treasury demand → higher yields
And when yields rise sharply, the ripple effect travels across almost every major asset class.
2. The Math of Pain: Why Bond Prices Fall When Yields Rise
The most fundamental rule of the bond market is simple:
Bond prices and bond yields move in opposite directions.
Imagine you bought a ₹1 lakh fixed deposit paying 7%.
You receive ₹7,000 per year.
Now imagine banks suddenly start offering new deposits at 9%.
Your old 7% investment becomes less attractive.
If you want to sell it, the buyer will demand a lower price so that their effective return becomes competitive with the new 9% market rate.
Treasury bonds work on the same basic principle.
The difference is scale.
A bond investor holding billions of dollars of long-duration securities can suffer enormous mark-to-market losses when yields rise.
This is precisely why duration matters.
Longer maturity = greater sensitivity
A 2-year Treasury is relatively less sensitive to a yield shock.
A 30-year Treasury can experience a dramatic price move from the same change in yield.
That is why rising long-term yields can become dangerous for:
- banks
- pension funds
- insurance companies
- leveraged investors
- mortgage markets
- growth stocks
3. Silicon Valley Bank Was the Warning Shot
The 2023 Silicon Valley Bank collapse demonstrated this mechanism in real life.
The problem wasn’t that the US government suddenly defaulted.
The bank held large quantities of securities that had been purchased when interest rates were much lower.
When the Federal Reserve aggressively raised rates, the market value of those securities declined.
As depositors demanded their money, the bank was forced to confront losses on assets that had previously appeared safe.
The lesson was brutally simple:
“Risk-free” does not mean “price-risk-free.”
US Treasuries have extremely low credit/default risk relative to most assets.
But long-duration Treasuries can still carry substantial interest-rate risk.
4. Washington’s Debt Problem Is Becoming a Yield Problem
The US fiscal equation is becoming increasingly important for investors.
The Congressional Budget Office projects that US net interest outlays will reach approximately $1.0 trillion in 2026.
More importantly, CBO projects net interest costs to rise to approximately $2.1 trillion by 2036.
That creates a dangerous feedback loop:
More debt → more interest expense → more borrowing → greater Treasury supply → potentially higher yields → even higher interest expense.
It doesn’t mean a US debt crisis is inevitable.
But it means the bond market has become increasingly important in determining how much the government ultimately pays to finance itself.
This is why investors should stop looking only at the Federal Reserve’s policy rate.
The Fed controls the short end of the curve.
The bond market controls the long end.
And the long end is becoming increasingly powerful.
5. Why 5% on the 10-Year Treasury Matters
The psychological importance of the 5% Treasury yield should not be underestimated.
At 2%, investors were forced to search aggressively for returns elsewhere.
At 5%, the calculation changes.
Suddenly, an investor can earn a relatively attractive nominal yield from a US government security without taking the same level of corporate, equity, or emerging-market risk.
That creates competition for capital.
Imagine two investments:
US Treasury: ~5% nominal yield
Risky growth stock: uncertain future earnings
The stock can still win—but it must offer enough expected upside to compensate for the additional risk.
That is the key mechanism behind the global repricing.
6. The $82 vs $61 Problem: Why Growth Stocks Suffer
This is where Treasury yields enter stock valuation.
Suppose a company is expected to generate $100 ten years from now.
At a 2% discount rate:
Present value ≈ $82
At a 5% discount rate:
Present value ≈ $61
The mathematics changes dramatically.
That is why high-growth companies can become particularly vulnerable when long-term yields rise.
Their valuation depends heavily on profits expected many years into the future.
Technology and AI companies often fall into this category.
The market isn’t necessarily saying:
“This company is bad.”
It may simply be saying:
“Those future profits are worth less at today’s higher discount rate.”
7. AI Has Another Problem: The Cost of Capital
The Treasury yield story becomes even more interesting because of the AI investment boom.
Large technology companies are spending enormous amounts on:
- data centers
- GPUs
- electricity infrastructure
- networking
- semiconductor capacity
- cloud infrastructure
MarketWatch reports that AI-related capital expenditure could reach approximately $1.1 trillion in 2027, while the corporate bond market is also facing exceptionally large issuance requirements.
This creates a strange paradox.
AI may be one of the biggest productivity opportunities in decades.
But financing the infrastructure required to build that future becomes more expensive when long-term yields rise.
Therefore:
Higher yields → higher financing costs → higher required returns → lower valuation multiples
That doesn’t automatically kill the AI bull market.
It simply raises the hurdle rate.
8. Gold Is Sending a Different Signal
While Treasury yields are rising, central banks are continuing to accumulate gold.
According to the World Gold Council, central banks purchased approximately 289 tonnes of gold in Q2 2026, a 62% year-over-year increase.
The largest buyers included:
- Poland: 51 tonnes
- China: 33 tonnes
- Uzbekistan: 16 tonnes
- Kazakhstan: 15 tonnes
Poland’s gold reserves reached approximately 632 tonnes by the end of June, while China’s reported holdings reached about 2,346 tonnes.
This is not necessarily a simple “anti-dollar” trade.
Central banks are diversifying reserves because gold has a unique characteristic:
It is not another country’s liability.
A Treasury bond is ultimately a financial claim on the US government.
Gold is not.
That distinction becomes more important when geopolitical and fiscal uncertainty rise.
9. Gold Has Already Crossed a Major Reserve Milestone
Morgan Stanley has highlighted a historic shift: gold’s share of central-bank reserves has surpassed US Treasuries for the first time since 1996.
That does not mean central banks are abandoning the dollar.
The dollar remains the dominant global reserve currency.
But it does indicate something more subtle:
Central banks increasingly want diversification away from a single reserve asset.
The trend is therefore less about “Gold replaces the dollar tomorrow” and more about:
Gold + Dollar + Other reserve assets
rather than dollar concentration alone.
10. Bitcoin: Digital Gold or Liquidity Thermometer?
Bitcoin provides an even more interesting experiment.
The “digital gold” narrative suggests Bitcoin should behave like a hedge against monetary instability.
But its actual trading behavior often looks more like a high-beta liquidity asset.
When:
- liquidity rises
- real yields fall
- dollar conditions ease
- risk appetite improves
Bitcoin can respond aggressively.
When:
- real yields rise
- liquidity tightens
- the dollar strengthens
- investors move toward safer assets
Bitcoin can experience sharp drawdowns.
Therefore, instead of thinking about Bitcoin only as “digital gold,” investors should also monitor it as a global liquidity thermometer.
11. The India Connection: Why Nifty Investors Must Watch US Yields
Now comes the most important part for Indian investors.
The US Treasury market doesn’t stop at Wall Street.
It directly influences India’s capital flows.
If US Treasury yields rise significantly, global investors may ask:
“Why take emerging-market risk when US government bonds are offering a much higher return?”
That can affect:
- FII flows
- USD/INR
- Indian bond yields
- Nifty valuation multiples
- banking stocks
- IT stocks
- small and mid-caps
But there is an important 2026 twist.
India’s domestic investor base has become significantly stronger.
SIP contributions and domestic mutual-fund participation provide an important counterweight to foreign selling.
For example, Indian equity mutual-fund inflows remained strong in July 2026, while SIP contributions reached approximately ₹31,961 crore.
This means the Indian market is no longer as dependent on foreign capital as it was in previous cycles.
12. But Don’t Use Old FII Data
This is where the original narrative needs an important update.
It would be misleading to say that FIIs simply pulled ₹40,000 crore from India throughout the first eight months of 2026.
By July and August, foreign investors had returned aggressively.
Data reported in September showed FIIs invested approximately ₹49,830 crore in Indian equities during July-August 2026.
August alone saw approximately $3.2 billion of foreign inflows, the strongest monthly level since September 2024.
That changes the story.
The correct conclusion isn’t:
“FIIs are permanently leaving India.”
It is:
“Global capital is becoming more selective.”
Money can leave one market and return quickly when the relative valuation, earnings outlook and currency equation improve.
13. The India-US Yield Spread Is the Number to Watch
For Indian investors, one of the most useful indicators is the difference between:
India 10-Year Government Bond Yield
and
US 10-Year Treasury Yield
This is the India-US yield spread.
If the spread becomes too narrow, Indian assets may become relatively less attractive to foreign investors after adjusting for:
- currency risk
- credit risk
- equity volatility
- geopolitical risk
This is particularly important for the RBI.
The central bank wants to support domestic growth.
But cutting rates too aggressively while US yields remain high can increase pressure on the rupee.
Therefore, the RBI isn’t operating in isolation.
The US yield curve is part of India’s monetary-policy equation.
14. The Rupee Is the Hidden Transmission Mechanism
Suppose the US 10-Year yield rises sharply.
Global investors may increase dollar exposure.
The dollar strengthens.
Emerging-market currencies can weaken.
If the rupee depreciates, Indian investors face another layer of pressure:
Higher imported inflation.
This matters especially for:
- crude oil
- electronics
- industrial commodities
- machinery
- imported components
India’s stock market can therefore experience a strange combination:
US yields ↑
Dollar ↑
Rupee ↓
Imported inflation ↑
RBI flexibility ↓
Equity valuation pressure ↑
This is the transmission mechanism that many retail investors miss.
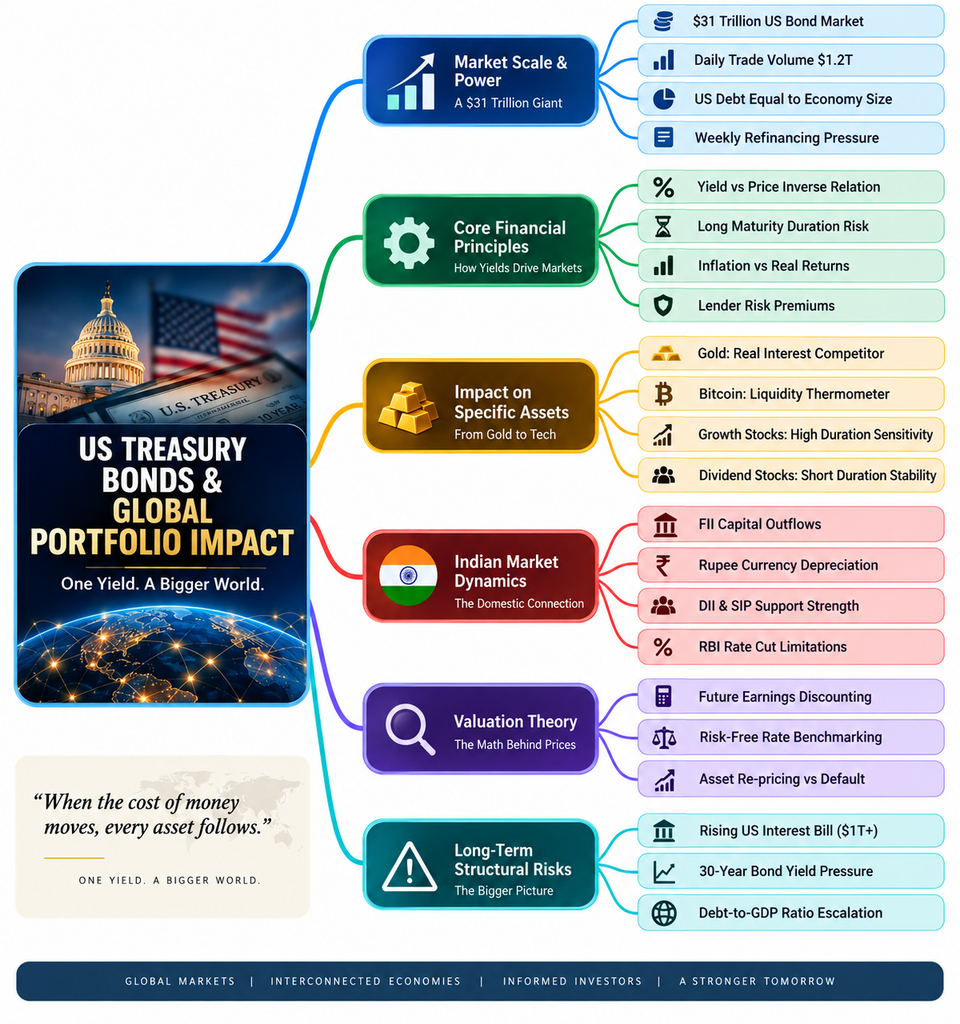
15. The 30-Year Treasury Is the Bigger Warning Signal
The 10-Year Treasury gets most of the headlines.
But long-term investors should also watch the 30-Year Treasury yield.
Why?
Because the 30-year yield reflects what investors demand to lend money to the US government over an extremely long horizon.
It captures expectations surrounding:
- inflation
- economic growth
- fiscal deficits
- Treasury supply
- term premium
- long-term monetary policy
The Fed can influence short-term rates.
It cannot simply dictate the 30-year yield.
The market decides.
And that is why the long end of the curve is becoming so important.
16. The New Global Hierarchy of Assets
For years, the investing hierarchy was relatively simple:
Cash → Bonds → Stocks → Speculative Assets
But the post-zero-rate world is different.
Investors now have to compare almost everything against a positive risk-free yield.
The question is no longer:
“Can this stock make money?”
The question is:
“Can this stock generate a return large enough to justify its risk compared with US Treasuries?”
That is a much higher standard.
And it explains why valuation matters again.
17. What Happens If the 10-Year Moves Above 5%?
This is the scenario investors should monitor.
Scenario 1: 10-Year stays below 4.5%
Risk assets could breathe easier.
- Growth stocks benefit
- Nifty valuations get support
- Emerging-market flows improve
- Bitcoin liquidity conditions become friendlier
Scenario 2: 10-Year moves toward 5%
This becomes a serious valuation test.
- Tech multiples face pressure
- Corporate borrowing becomes more expensive
- Dollar strength can increase
- Emerging-market assets become less attractive
Scenario 3: 10-Year breaks materially above 5%
The market may start asking a much bigger question:
Is the rise caused by stronger economic growth—or deteriorating fiscal confidence?
If growth is driving yields higher, equities may survive.
If inflation and fiscal concerns are driving yields higher, the outcome could be much more painful.
That distinction is critical.
18. The Most Important Dashboard for Investors
Instead of watching 20 different indicators, investors can build a simple global dashboard.
Every morning, check:
1. US 10-Year Treasury Yield
The global valuation benchmark.
2. US 30-Year Treasury Yield
The long-term fiscal/inflation signal.
3. US 10Y Real Yield
The inflation-adjusted cost of money.
4. Dollar Index
The global liquidity and currency signal.
5. Gold
The reserve-diversification and geopolitical hedge signal.
6. Brent Crude
The inflation shock indicator.
7. USD/INR
The Indian transmission mechanism.
8. Nifty
The final domestic equity response.
9. Bitcoin
The high-beta liquidity indicator.
19. The Real Risk Isn’t 5%—It’s the Speed
One of the biggest mistakes investors make is focusing only on the absolute yield.
The speed of the move can be just as important.
A Treasury yield moving gradually from 4.5% to 5% may be absorbed by markets.
A sudden jump from 4% to 5% can trigger a very different reaction.
Why?
Because portfolios need time to adjust.
Pension funds rebalance.
Banks revalue securities.
Corporations reconsider borrowing.
Private-equity deals get repriced.
Growth stocks experience multiple compression.
Emerging-market currencies come under pressure.
The entire financial system has to reset its required return.
20. The $1 Trillion Interest Bill Changes the Equation
The US government’s interest burden is becoming a structural issue rather than a temporary headline.
CBO estimates net interest outlays at approximately $1.0 trillion in 2026, rising toward $2.1 trillion by 2036 under its baseline projections.
That creates a mathematical problem.
If average borrowing costs remain high while debt continues increasing, interest expense consumes a larger portion of government resources.
This doesn’t automatically cause a crisis.
The US issues debt in its own currency and remains the issuer of the world’s dominant reserve currency.
But it does mean the market will increasingly scrutinize the relationship between:
Debt growth + economic growth + inflation + Treasury yields.
21. The New Investment Rule: Watch the Yield Before the Stock
The next time you see your favorite technology stock fall 5%, don’t immediately ask:
“What happened to the company?”
First ask:
“What happened to the discount rate?”
If the US 10-Year Treasury yield has jumped sharply, part of the decline may have nothing to do with company-specific fundamentals.
The same logic applies to Nifty.
If Nifty suddenly falls despite no major domestic negative news, check:
US 10Y → Dollar → Crude → USD/INR → FII flows → Nifty
That sequence can often explain more than a dozen individual headlines.
Conclusion: The Remote Control Is Sitting in the Bond Market
The biggest misconception in modern investing is that stocks control the market.
They don’t.
The price of money controls the market.
And one of the most important expressions of that price is the US 10-Year Treasury yield.
In 2026, investors are dealing with a very different world:
- US marketable Treasury debt is around $31.5 trillion.
- Total US federal debt has crossed $40 trillion.
- US net interest costs are around $1 trillion in 2026.
- CBO projects roughly $2.1 trillion of annual net interest costs by 2036.
- Central banks bought 289 tonnes of gold in Q2 2026, up 62% year over year.
- The US 10-Year yield is approaching the psychologically important 5% level.
- Indian domestic flows remain a powerful counterweight to foreign capital movements.
The world has therefore entered an era where the risk-free rate is no longer close to zero.
And when the risk-free rate rises, every other asset must prove why it deserves your money.
So the next time you look at Nifty, Nasdaq, gold or Bitcoin, don’t just ask where the price is going.
Ask one more question:
What is the US 10-Year Treasury yield doing?
Because that number may be the closest thing financial markets have to a global remote control.
Disclaimer
This article is for educational and informational purposes only and should not be considered financial, investment, trading, tax, or legal advice. The information, market data, statistics, projections, and opinions presented in this article are based on publicly available sources and are subject to change without notice.
Financial markets—including stocks, bonds, commodities, currencies, gold, and cryptocurrencies—carry significant risks. Past performance does not guarantee future results. The discussion of the US Treasury yields, Nifty, Bitcoin, gold, FII/DII flows, interest rates, and other market indicators is intended to explain potential market relationships and should not be interpreted as a recommendation to buy, sell, or hold any security or financial instrument.
Investors should conduct their own research and consider their financial objectives, risk tolerance, and investment horizon before making any investment decision. Where appropriate, consult a SEBI-registered investment adviser or other qualified financial professional.
The author/publisher assumes no responsibility for any financial loss or damage arising from decisions made based on the information contained in this article.
10 SEO-friendly :
- US 10-Year Treasury Yield: The $32 Trillion Remote Control of Global Markets
- Why the US 10-Year Treasury Yield Controls Stocks, Gold, Bitcoin & Nifty in 2026
- US Treasury Yield Explained: How One Number Moves Nifty, Nasdaq, Gold & Bitcoin
- The US 10-Year Yield Is Rising: What It Means for Nifty, Gold, Bitcoin & AI Stocks
- US 10-Year Treasury Yield Nears 5%: Why Global Markets Are Getting Nervous
- The $32 Trillion Bond Market: Why Treasury Yields Matter More Than Your Stock Chart
- US 10-Year Treasury Yield and Nifty: The Hidden Link Every Indian Investor Should Know
- Why Rising US Treasury Yields Could Crush Growth Stocks, Bitcoin and Nifty
- US Bond Yields Explained: The Hidden Force Behind Stocks, Gold, Bitcoin & the Rupee
- The Global Market Remote Control: How US Treasury Yields Dictate Your Net Worth