

Why the Land of the Rising Sun Is Casting a Shadow Over Dalal Street
The Indian stock market delivered another sharp reality check on September 15, 2026.
The session initially looked constructive. IT stocks recovered strongly, HDFC Bank remained relatively resilient, and the Nifty attempted to reclaim higher levels. But the optimism did not last.
By the close, the Nifty 50 fell 1.19% to 23,118.60, its lowest level in roughly five months, while the Sensex declined 1.04% to 74,003.82. The broader market performed even worse, with mid-cap and small-cap indices falling more than 2%.
The most important part of the sell-off, however, was not simply the index decline.
It was the combination of oil, bond yields, currencies, central-bank policy and global liquidity.
Three major macro forces are colliding:
Rates + Crude + Currency = Pressure on Indian Equities
And sitting quietly in the background is Japan.
1. The Gap-Up Trap: Why the Early Recovery Failed
The market opened with optimism, particularly after a strong rebound in technology stocks.
The Nifty IT Index gained around 3% during the session, while HDFC Bank also showed relative strength. Yet the broader market could not sustain the recovery. Financial and automobile stocks remained under pressure, and selling accelerated later in the session.
This is an important technical signal.
A market that:
- opens higher,
- attracts buying,
- fails to hold the opening gains,
- and closes near the lower end of the day’s range
is showing distribution rather than accumulation.
In simple words:
Buyers appeared — but sellers were stronger.
The Nifty finally settled at 23,118.60, meaning the psychological 23,000 zone is now extremely important for traders.
Key Nifty Levels to Watch
| Level | Importance |
|---|---|
| 23,000 | Major psychological support |
| 23,100–23,150 | Immediate support zone |
| 23,300–23,350 | First recovery/resistance zone |
| 23,500 | Major upside hurdle |
| Below 23,000 | Risk of another selling wave |
A sustained break below 23,000 would make the technical picture considerably weaker.
2. The Invisible Domino: Yen Carry Trade and the Bank of Japan
This is where Japan enters the story.
For years, global investors have used Japan’s low interest rates to borrow cheaply in yen and invest in higher-yielding assets around the world.
This strategy is commonly known as the yen carry trade.
The basic idea is simple:
Borrow cheap yen → convert into another currency → buy higher-return assets → earn the interest-rate differential.
The problem starts when the yen strengthens, or Japanese interest rates rise.
Suddenly, the investor’s funding cost increases while the value of the yen-denominated liability rises.
That can force investors to reduce positions in riskier markets.
Why September 18 Matters
The Bank of Japan’s monetary policy meeting is scheduled for September 17–18, 2026.
The current BOJ policy rate is around 1.0%, and markets are expecting a 25-basis-point hike to 1.25%. Reuters reported that the majority of economists expect the BOJ to move to 1.25% at this meeting.
This is an important correction to the popular 0.50% hike narrative.
The actual risk is not only the hike
The bigger risk for global markets is:
What does the BOJ say about future hikes?
If the BOJ signals that 1.25% is not the end of the tightening cycle, the yen could strengthen further.
That could increase pressure on leveraged carry-trade positions.
And when global funds need liquidity, they usually sell assets that are:
- liquid,
- highly valued,
- easy to hedge,
- and easy to exit.
Indian large-cap equities can therefore become part of the global deleveraging process.
This does not mean every Indian stock is being sold specifically because of Japan.
Rather, Japan can act as a liquidity shock amplifier.
3. The Bond Yield Trap: The Global Cost of Money Is Rising
The second major problem is the bond market.
The US 10-year Treasury yield crossed 5%, reaching levels not seen since 2023 and creating significant pressure across global financial markets. Reuters reported that the surge in global government borrowing costs has pushed yields to their highest levels since the global financial crisis era.
Why does this matter to India?
Because global investors constantly compare:
Equity return v. bond return. Currency risk.
When US Treasury yields rise sharply, the opportunity cost of holding emerging-market assets increases.
For India, this creates pressure through several channels:
- Higher global borrowing costs
- Stronger dollar
- Pressure on emerging-market currencies
- Foreign portfolio outflows
- Lower valuation multiples
- Higher domestic bond yields
And India’s own bond market is also under pressure.
The benchmark Indian 10-year government bond yield was around 7.02%, with yields rising after the RBI announced a large open-market sale of government securities.
The RBI has announced ₹1 lakh crore of government bond sales over the fortnight, including a ₹50,000 crore operation initially.
That means the market is facing a complicated liquidity equation:
Global yields ↑ + Indian yields ↑ + oil ↑ = equity valuation pressure
4. Why Banks Are Vulnerable
Banks are particularly sensitive to interest-rate and bond-market movements.
The RBI’s current SLR requirement is 18%, meaning banks have to maintain a specified portion of their liabilities in eligible liquid assets, including government securities.
However, it would be incorrect to assume that every government bond held by a bank immediately becomes a huge profit-and-loss loss whenever yields rise.
Accounting treatment matters.
Government securities can sit in different categories, including:
- Held to Maturity (HTM)
- Available for Sale (AFS)
- Fair Value Through Profit and Loss (FVTPL)
Therefore, the impact of rising yields depends on the bank’s portfolio composition and accounting classification.
Nevertheless, rising yields can still create pressure through:
1. Mark-to-market pressure
AFS/FVTPL securities can experience valuation changes as yields rise.
2. Funding-cost pressure
Higher market rates can increase the cost of raising funds.
3. NIM pressure
If lending rates cannot adjust as quickly as funding costs, net interest margins can come under pressure.
4. Credit-demand risk
Persistent high rates can eventually reduce borrowing and investment activity.
So the banking problem is not simply:
“Bond prices are falling.”
It is:
Higher yields can simultaneously affect valuations, funding costs, liquidity and credit demand.
5. The Biggest Immediate Threat: Crude Oil
If Japan represents the liquidity risk, crude oil represents India’s inflation and current-account risk.
And this is currently the more immediate trigger.
Brent crude moved above $100 per barrel, with prices around $107–108 during the September 15 session as geopolitical tensions intensified. Reuters reported Brent around $107.8 during the Indian market sell-off.
That is a major problem for an oil-importing economy like India.
Think of the chain reaction:
Crude ↑
↓
Import bill ↑
↓
Trade deficit pressure ↑
↓
Rupee pressure ↑
↓
Inflation risk ↑
↓
Interest-rate expectations ↑
↓
Equity valuations ↓
This is why oil is much more than a commodity story for India.
6. Strait of Hormuz: The Geopolitical Risk Premium
The energy problem becomes even more serious when shipping routes are disrupted.
The Strait of Hormuz is one of the world’s most important energy chokepoints.
Recent shipping data showed vessel transits through Hormuz falling sharply, with only seven vessel movements recorded on September 9, compared with a 10-day average of 14.
At the same time, geopolitical tensions involving Iran, Yemen and Saudi energy infrastructure have increased concerns about supply disruptions.
This creates what economists call a geopolitical risk premium in crude prices.
The market does not necessarily need actual supply destruction to push oil higher.
Sometimes the fear of future supply disruption is enough.
And that is precisely what makes the current environment dangerous.
7. India Is Feeling the Currency Pressure Too
The rupee has also come under significant pressure.
Reuters reported that the rupee settled around ₹95.955 per US dollar on September 15, its weakest level in more than a month, as high oil prices and expectations of tighter US monetary policy weighed on sentiment.
This is very different from the ₹83–84 levels mentioned in older market narratives.
That figure should therefore not be used in a current September 2026 article.
The current macro equation is closer to:
USD/INR ~96 + Brent ~$108 + US 10Y >5%
That combination is considerably more uncomfortable for Indian equities.
8. India VIX: The Volatility Regime Is Changing
Another important indicator is the India VIX.
For months, relatively low volatility encouraged traders to buy dips and sell volatility.
But when crude rises, bond yields rise, and central banks become unpredictable, implied volatility can expand rapidly.
The critical point is not whether VIX is exactly 12, 13 or 14 on one particular day.
The important question is:
Is volatility making a structural move higher?
If VIX continues rising while Nifty remains below important resistance, traders should expect:
- larger intraday swings,
- wider option premiums,
- faster stop-loss triggers,
- increased gap risk,
- and more aggressive institutional hedging.
This is why option traders should be especially careful with oversized naked positions.
9. The Fed Adds Another Layer of Uncertainty
Japan is not the only central bank investors are watching.
The US Federal Reserve is also at the center of the current market debate.
Markets are pricing a possible 25-basis-point Fed hike, while inflation remains elevated because of the energy shock.
That creates an unusual situation.
Normally, falling interest rates support equities.
But if oil rises sharply, central banks can face a difficult choice:
Fight inflation or support growth?
If central banks remain hawkish, liquidity becomes tighter.
If they become dovish while inflation remains high, markets may worry that inflation will remain persistent.
Either way, volatility can remain elevated.
10. The Four Hidden Forces Behind the Sell-Off
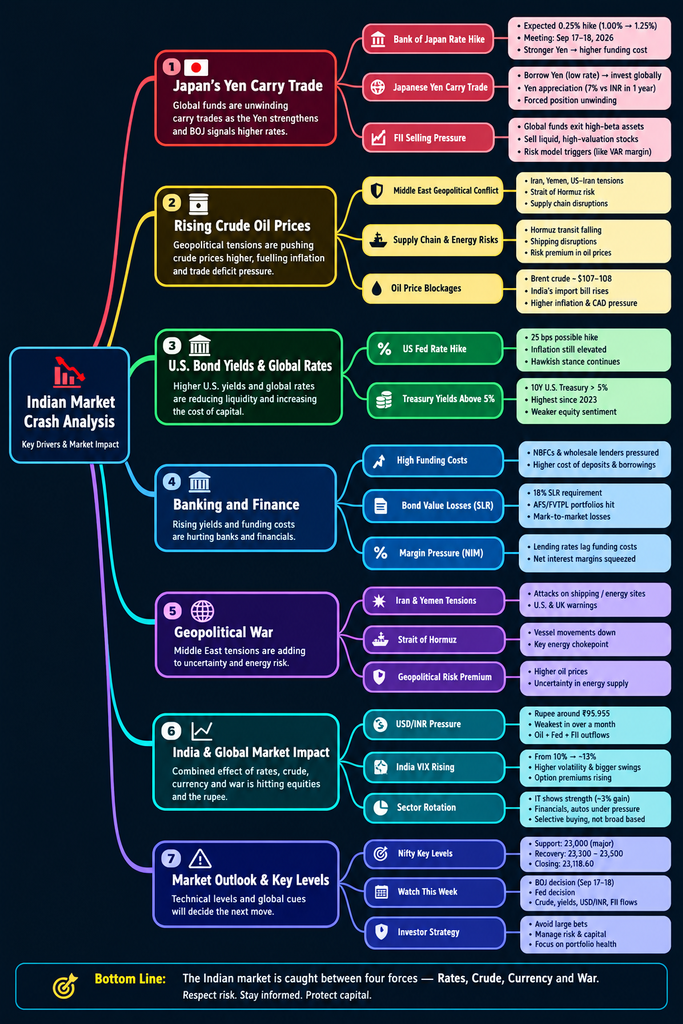
The current market weakness can therefore be simplified into four major forces:
Force 1: Japan
BOJ tightening → stronger yen → carry-trade risk → global deleveraging
Force 2: Bonds
US 10Y above 5% → higher global discount rate → lower equity valuations
Force 3: Oil
Brent above $100 → inflation + import bill + rupee pressure
Force 4: Geopolitics
Iran/Yemen/Hormuz tensions → higher risk premium → uncertain energy supply
These forces reinforce each other.
That is the dangerous part.
11. Why IT Stocks Still Have Relative Strength
One interesting feature of the September 15 sell-off was the resilience of Indian IT stocks.
The Nifty IT Index gained around 3%, while the broader market declined sharply.
This shows that the market is not selling everything indiscriminately.
Investors are rotating between sectors.
IT received support after renewed confidence around AI-related developments, while financials, autos and several cyclical areas remained under pressure.
This distinction is important.
A market correction is not necessarily the same thing as a complete risk-off event.
Sector rotation can continue even during an index-level sell-off.
12. What Happens If Nifty Breaks 23,000?
The 23,000 level has now become the psychological battlefield.
The September 15 closing level was 23,118.60.
Therefore:
Bullish scenario
If Nifty holds 23,000 and quickly reclaims 23,300–23,350, short-covering could push the index toward 23,500.
Neutral scenario
If Nifty remains between 23,000 and 23,350, expect high volatility and sector rotation.
Bearish scenario
A decisive break below 23,000 could open the door to another leg lower, particularly if crude remains above $105 and US Treasury yields stay above 5%.
For traders, 23,000 is therefore more important than trying to predict the exact bottom.
13. The Real Risk Is Not One Rate Hike
It would be too simplistic to say:
“BOJ hikes rates, therefore Nifty crashes.”
Markets are much more complicated.
The bigger risk is the interaction between different variables.
Imagine this combination:
BOJ +25 bps
Yen strengthens
US 10Y stays above 5%
Brent stays above $105
Rupee remains near ₹96
FII selling continues
That would create a much stronger liquidity shock than any single event by itself.
Conversely, if:
- oil falls,
- yields retreat,
- rupee stabilizes,
- BOJ communicates cautiously,
- and FIIs return,
then the same Nifty can produce a sharp relief rally.
14. What Investors Should Watch This Week
The next few sessions are likely to be driven by macroeconomic data rather than individual corporate earnings.
Key indicators
| Indicator | Why it matters |
|---|---|
| BOJ decision | Yen + carry trade |
| US Fed decision | Global liquidity |
| Brent crude | Inflation + India’s trade balance |
| US 10Y yield | Global discount rate |
| USD/INR | Foreign-flow pressure |
| India VIX | Market volatility |
| FII flows | Institutional positioning |
| Nifty 23,000 | Technical support |
| Nifty 23,300–23,500 | Recovery zone |
The BOJ’s official schedule confirms the September policy meeting for September 17–18, with the monetary-policy statement scheduled for September 18.
15. Final Verdict: Temporary Correction or Structural Warning?
The Indian market’s current weakness cannot be explained by Japan alone.
The more accurate explanation is a global liquidity squeeze amplified by oil and geopolitical risk.
Japan is important because the yen carry trade can accelerate deleveraging.
The US bond market is important because a 5% Treasury yield changes global valuation mathematics.
Crude is important because India imports energy.
The rupee is important because currency depreciation can increase imported inflation.
And the Fed and BOJ are important because their policy decisions determine the direction of global liquidity.
So the market is effectively caught between:
Rates, Crude, Currency and War.
The next major test is therefore not simply whether Nifty can bounce.
The real question is:
Can Nifty defend 23,000 while Brent remains above $100 and the US 10-year yield remains above 5%?
If yes, the current sell-off could eventually become a major oversold recovery opportunity.
If no, the market may be entering a deeper valuation reset.
And that is why the September 18 BOJ decision could become one of the most important macro events for Dalal Street this month.
Key Takeaway for Traders
Nifty: 23,118.60
Immediate support: 23,000
Recovery zone: 23,300–23,500
Brent crude: ~$107–108
US 10Y: >5%
USD/INR: ~₹95.96
BOJ meeting: September 17–18
Expected BOJ rate: 1.25%
Major macro risks: Oil + Yields + Yen + Geopolitics
The market is not necessarily telling investors to panic.
It is telling them to respect risk.
In a high-volatility environment, capital preservation can be more important than catching the exact bottom.
Disclaimer
This article is for educational and informational purposes only and should not be considered investment advice. Market conditions can change rapidly, especially during periods of geopolitical stress, central-bank policy changes, and elevated volatility. Investors should conduct their own research and consult a qualified financial adviser before making investment decisions.
Top 10 SEO Titles
- Why Is the Indian Stock Market Crashing? 4 Hidden Forces Behind Nifty’s Fall
- Nifty Crash Explained: How Japan, Crude Oil, Bond Yields and War Are Hitting Dalal Street
- Indian Stock Market Crash: 4 Major Risks Dragging Nifty and Bank Nifty Lower
- Why Nifty Is Falling Today: Japan Rate Hike, Crude Oil and FII Selling Explained
- Bank of Japan Rate Hike: Why Japan Could Trigger Another Nifty Crash
- Nifty at Risk Below 23,000? Japan, Oil and US Bond Yields Signal More Volatility
- Indian Market Crash Explained: The Yen Carry Trade, Crude Oil and Global Liquidity Trap
- Nifty 50 Crash: How the BOJ, US Bond Yields and $100+ Crude Are Hurting India
- Dalal Street Under Pressure: 4 Hidden Reasons Behind the Nifty and Bank Nifty Sell-Off
- Is the Nifty Crash Just Beginning? Japan’s Yen, Crude Oil and Global Rates Hold the Key