
India Stock Market | Nifty | Bank Nifty | Crude Oil | Iran-Israel Conflict | US CPI | Yen Carry Trade | FII Flows
The Indian stock market is currently caught between two powerful forces: domestic liquidity and global risk-off pressure.
The sharp reversal seen during the latest trading session may look like a classic technical recovery, but beneath the surface the market remains extremely sensitive to crude oil, global bond yields, geopolitical developments and foreign institutional positioning.
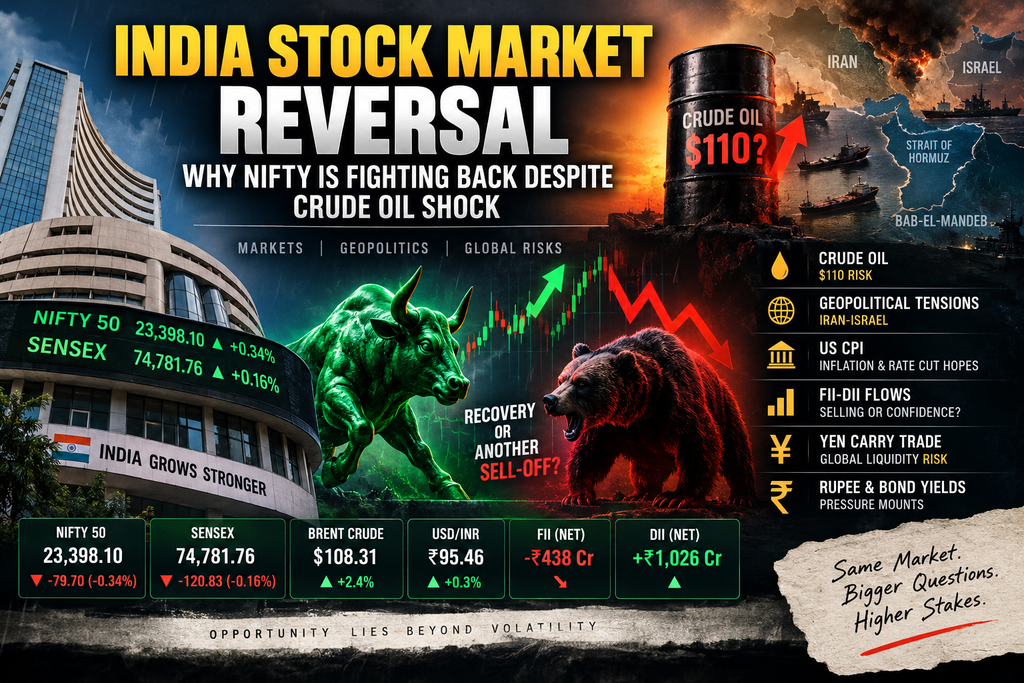
On September 11, 2026, the Nifty 50 eventually closed at 23,398.10, down 79.70 points or 0.34%, while the Sensex fell 120.83 points to 74,781.76. What made the session particularly important was the magnitude of the intraday reversal. The Nifty had fallen to around 23,240 levels in the morning before recovering a substantial part of its losses.
This raises the key question:
Was the recovery the beginning of a genuine market reversal—or simply another short-covering rally inside a larger risk-off trend?
1. The Whiplash of the Bearish Open: A Test of Technical Resilience
The September 11 session began under intense pressure.
Brent crude moved above $108 per barrel, while Asian markets were also under pressure. The combination of higher energy prices, geopolitical uncertainty and rising bond yields created a difficult environment for Indian equities.
At one point, the Nifty was down roughly 1%, trading near 23,243, while the broader market was also under pressure. Financials, metals and automobiles were among the sectors facing significant selling pressure.
Yet the market refused to collapse.
By the close:
- Nifty 50: 23,398.10
- Sensex: 74,781.76
- Nifty intraday low: around 23,240
- Nifty weekly decline: approximately 2.7%
- Sensex weekly decline: approximately 2.9%
- Indian 10-year bond yield: above 7%
- Rupee: around ₹95.46 per US dollar
- Brent crude: briefly above $108
The Nifty and Sensex therefore remained under pressure for a fifth consecutive week, even after the intraday recovery.
That distinction is critical.
A strong intraday recovery does not automatically mean a trend reversal.
It can also indicate aggressive short covering after an oversold opening.
2. The Oversold Paradox: Why Bad Markets Can Suddenly Explode Higher
Markets behave differently when positioning becomes extremely one-sided.
When traders become heavily bearish, even a relatively small positive catalyst can produce a disproportionate upside move.
Why?
Because short sellers eventually have to buy back their positions.
This creates a feedback loop:
Oversold market → positive catalyst → short covering → index rises → more shorts exit → further buying.
This is the classic short-squeeze mechanism.
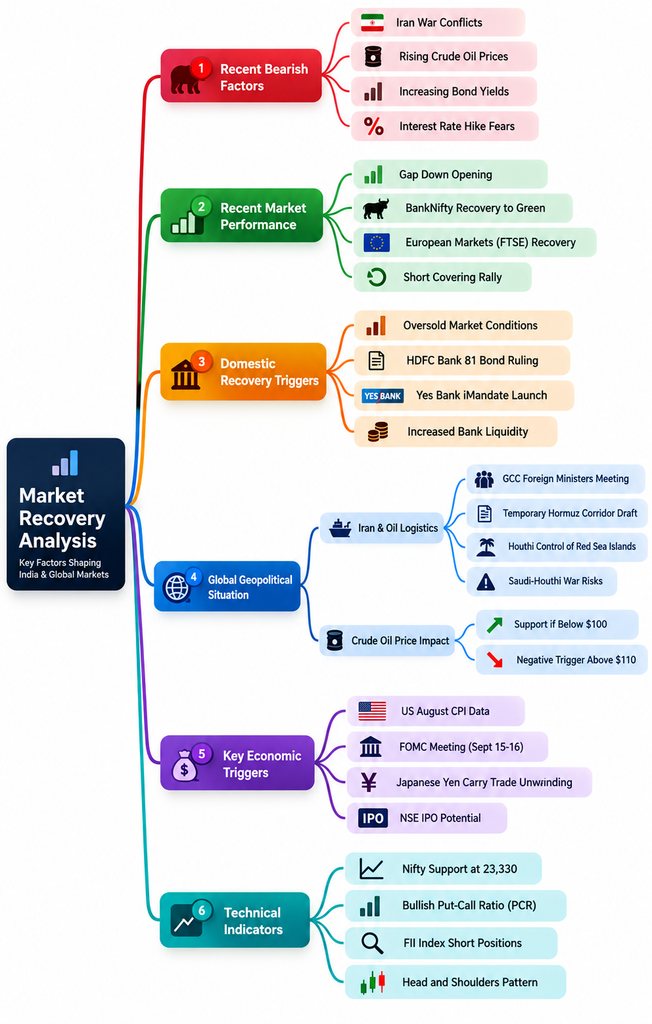
The recent performance of HDFC Bank provides an interesting example. HDFC Bank gained around 2% on September 11, making it one of the major positive contributors even while the broader market remained weak.
This type of divergence is important because it tells us that institutional investors are not abandoning every part of the Indian market.
Instead, capital is becoming increasingly selective.
Consultant’s Takeaway
In an extremely bearish market, the first rally is often driven by position adjustment rather than a complete change in fundamentals.
That is why traders should distinguish between:
Short covering ≠ fresh long-term buying
3. Crude Oil Has Become the Market’s Biggest Macro Variable
For India, crude oil is not simply another commodity.
It is a macroeconomic transmission mechanism.
Higher crude prices can simultaneously affect:
- Inflation
- Current-account dynamics
- Rupee valuation
- Corporate margins
- Transportation costs
- Government finances
- Interest-rate expectations
- Foreign investor sentiment
The recent geopolitical escalation pushed Brent crude above $108 per barrel, although prices later retreated sharply from the intraday highs. Reports indicated Brent moved close to $110 before falling back toward the $104 area as traders reacted to diplomatic developments and profit-taking.
This creates three important crude zones for Indian equities.
Brent Crude: Market Risk Map
| Brent Price | Market Interpretation |
|---|---|
| Below $100 | Significant relief for India |
| $100–105 | Manageable but inflation-sensitive |
| $105–107 | Current stress/status-quo zone |
| $107–110 | Increasing risk-off pressure |
| Above $110 | Potential new global risk-off phase |
The $110 level therefore remains psychologically and fundamentally important.
A sustained move above $110 would raise fresh concerns about inflation and global interest rates.
But if Brent repeatedly fails near $108–110 and falls back below $105, the pressure on Indian equities could ease considerably.
4. The Red Sea and Bab-el-Mandeb: Why Shipping Risk Matters
The Middle East situation is no longer only an Israel-Iran story.
It has increasingly become a global shipping and energy-security story.
The Bab-el-Mandeb chokepoint connects the Red Sea with the Gulf of Aden and is strategically important for energy and global trade flows.
Recent developments involving Iran-aligned Houthi forces and the Red Sea have increased concerns about maritime security and the possibility of prolonged disruption to shipping routes. Reuters reported that Houthi forces had captured Yemen’s port city of Mocha and advanced along strategically important Red Sea routes.
This matters for investors because shipping disruption can create a second-order inflation shock:
Geopolitical escalation → shipping disruption → freight costs → energy prices → inflation expectations → bond yields → equity valuation pressure
Therefore, even if oil prices temporarily fall, the geopolitical risk premium may remain embedded in crude and freight markets.
5. The Hormuz Question: Temporary Relief or Sustainable Solution?
Another major variable is the possibility of diplomatic arrangements concerning maritime traffic through the Strait of Hormuz.
Any credible arrangement that improves the movement of oil tankers could produce an immediate decline in the geopolitical risk premium.
That would be particularly positive for oil-importing economies such as India.
However, investors should distinguish between:
Diplomatic proposal
and
Operationally secure shipping corridor.
A sustainable maritime solution requires much more than political statements.
It potentially involves:
- Mine-clearing
- Naval coordination
- Vessel identification
- Traffic management
- Insurance availability
- Intelligence sharing
- Security guarantees
Therefore, any diplomatic headline should initially be treated as a risk-premium reducer, rather than automatically interpreted as the end of the geopolitical crisis.
6. The Macro Hedge: The Yen Carry Trade Is Back on the Radar
One of the most underappreciated risks for emerging markets is the potential unwinding of the Japanese yen carry trade.
The basic structure is simple:
Borrow cheaply in yen → invest in higher-yielding global assets → earn the yield differential.
For years, this trade supported liquidity across global markets.
But the equation changes when the yen strengthens, and the Bank of Japan becomes more hawkish.
Recent market moves show that the yen has strengthened sharply as investors increasingly anticipate a more aggressive Bank of Japan policy path.
Reuters reported that the yen had strengthened almost 5% against several major carry-trade currencies during September, while cross-border yen borrowing—a proxy for the scale of the carry trade—had reached roughly ¥360 trillion according to Jefferies’ analysis of BIS data.
That number makes the risk impossible to ignore.
If the yen continues strengthening:
Yen appreciation → carry-trade losses → deleveraging → global asset selling → emerging-market pressure
India does not necessarily have to become fundamentally bearish for Indian equities to fall.
Global investors can sell or hedge Indian index exposure simply because their overall portfolio risk is being reduced.
This is why FII index shorts should not automatically be interpreted as a direct rejection of India’s long-term economic story.
7. The FII vs DII Battle: Foreign Selling Meets Domestic Liquidity
The Indian market is currently witnessing an important structural battle.
Foreign investors remain cautious while domestic institutions continue providing liquidity.
On September 11, FIIs were reported as net sellers of around ₹438 crore, while domestic institutional investors bought approximately ₹1,026 crore.
This creates an important market dynamic:
Foreign Investors
- Sensitive to global rates
- Sensitive to crude
- Sensitive to the rupee
- Sensitive to yen carry-trade risk
- More likely to hedge index exposure
Domestic Institutions
- Supported by domestic savings
- SIP-driven liquidity
- Less sensitive to short-term global volatility
- Can absorb part of FII selling
This explains why the Indian market can experience aggressive intraday selling without necessarily entering a complete structural collapse.
Domestic liquidity is acting as the shock absorber.
8. The US CPI Shock: The Number That Changed the Weekend Narrative
The US inflation data has now provided another important piece of the puzzle.
The August 2026 US CPI increased 3.4% year-over-year, while monthly CPI rose 0.4%. Core CPI increased 0.3% month-over-month.
The headline number was broadly in line with expectations, but the underlying inflation picture remained uncomfortable for markets.
This matters because oil is already creating an additional inflation risk.
The chain reaction is straightforward:
Higher crude → higher inflation expectations → higher bond yields → higher discount rates → lower equity valuations
That is particularly dangerous for expensive growth stocks and highly leveraged economies.
The US 10-year Treasury yield moving close to 5% has therefore become another major pressure point for global equities.
9. India’s 10-Year Bond Yield Above 7% Is Another Warning Signal
One of the most important data points that equity investors should not ignore is the Indian bond market.
India’s 10-year government bond yield moved above 7%, reaching its highest level in more than three months,s according to Reuters.
This creates a valuation problem.
When bond yields rise:
Risk-free return rises → equity risk premium gets compressed → high-P/E stocks become less attractive.
Therefore, even if Nifty earnings remain stable, rising bond yields can limit how much investors are willing to pay for those earnings.
This is one reason why a crude-driven bond-market shock can eventually become an equity-market valuation shock.
10. The Rupee Problem: ₹95+ Per Dollar Adds Another Layer of Risk
The Indian rupee has also come under pressure.
The rupee was reported around ₹95.46 per US dollar on September 11, with crude prices and foreign portfolio outflows contributing to the weakness.
A weaker rupee increases the domestic cost of imported crude.
This creates a circular problem:
Crude ↑ → Import bill ↑ → Rupee pressure ↑ → Imported inflation ↑ → Bond yields ↑ → Equity valuation pressure ↑
Therefore, the combination of:
Brent > $105 + USD/INR near ₹95+ + Indian 10Y > 7%
is significantly more important than any single indicator by itself.
11. The Real Market Map: Three Scenarios for Nifty
The market is now entering a high-volatility decision zone.
Scenario 1: Bullish Relief
Conditions:
- Brent falls below $105
- Geopolitical tensions ease
- US yields stabilize
- Rupee stops weakening
- FIIs reduce index shorts
- Bank Nifty sustains above important resistance
In this situation, the recent fall could become a medium-term buying opportunity.
Scenario 2: Sideways Short-Covering
This is arguably the most interesting near-term scenario.
Conditions:
- Brent remains between $104–108
- Geopolitical headlines remain mixed
- FIIs remain cautious
- Domestic institutions continue buying
- Nifty holds the 23,200–23,300 region
The market could then remain trapped in a wide range.
In this environment, rallies can continue to be sold while sharp falls attract domestic buying.
Scenario 3: Renewed Risk-Off
This becomes dangerous if:
- Brent decisively breaks above $110
- USD/INR moves substantially higher
- US Treasury yields continue rising
- Yen appreciation accelerates
- Geopolitical escalation worsens
- FIIs increase index shorts
Under this scenario, the recent recovery could prove to be nothing more than short covering before another selling wave.
12. The Most Important Levels for Traders
From a technical perspective, the Nifty’s immediate battlefield is around the 23,300 zone.
Nifty Map
23,300–23,400: Immediate decision zone
23,500–23,600: Important recovery/resistance area
Above 23,600: Short-covering could become stronger
Below 23,200: Recovery structure becomes weaker
Around 23,070: Important downside reference
The market should therefore not be judged merely by whether it closes green or red.
The more important question is:
Where does Nifty close relative to the 23,300–23,600 recovery band?
13. The Bigger Picture: Liquidity Has Not Disappeared—It Has Become Defensive
The most important conclusion from the current market action is that liquidity has not disappeared.
It has become defensive.
Domestic institutions are absorbing part of the foreign selling.
Short sellers are taking profits when the market becomes extremely oversold.
Energy stocks can outperform when crude rises.
Banks can rally on stock-specific developments.
But none of these individually confirms a sustainable bull-market reversal.
The market still needs confirmation from the macro side.
Conclusion: The Market Is Waiting for the Next Catalyst
The latest reversal should therefore be viewed with caution.
The Indian market has demonstrated remarkable technical resilience despite:
- Brent crude moving above $108
- US 10-year yields approaching 5%
- India’s 10-year yield moving above 7%
- The rupee trading around ₹95+ per dollar
- Continued geopolitical uncertainty
- A potential yen carry-trade unwind
- Persistent FII selling
At the same time, domestic institutional buying and selective stock-specific strength are preventing a complete breakdown.
This creates a classic liquidity trap.
The market can rally sharply even while the macro environment remains hostile.
But that does not necessarily mean the primary trend has changed.
For the next major move, investors should watch five numbers/events:
1. Brent Crude — $110
A sustained break above this level would significantly increase risk-off pressure.
2. Nifty — 23,300
Holding this zone can keep the recovery structure alive.
3. Nifty — 23,600
A sustained break above this area would make the short-covering argument considerably stronger.
4. US 10-Year Yield — 5%
A sustained move above this psychological level would increase pressure on global equity valuations.
5. USD/INR — ₹95+
The rupee’s ability to stabilize will be crucial for India’s imported inflation outlook.
Final Verdict
The current green shoots should not yet be called a confirmed bull-market reversal.
The evidence is more consistent with a market caught between domestic liquidity, aggressive short covering, and a hostile global macro backdrop.
If crude retreats below $105 and Nifty reclaims 23,500–23,600 with strong participation, the recovery thesis becomes much stronger.
If Brent breaks above $110 while Nifty loses 23,200–23,300, the current rebound could prove to be nothing more than a temporary liquidity-driven bounce.
In other words:
The next major direction of the Indian stock market may not be decided in Dalal Street alone. It may be decided simultaneously in Tehran, Tokyo, Washington and the crude-oil market.
The liquidity is still there. The question is whether it is strong enough to overpower the geopolitical and global-rate shock.
FAQ at the end
Is the Indian stock market recovering?
The latest recovery is not yet enough to confirm a major trend reversal. Nifty remains sensitive to crude oil, global yields, geopolitical risk and FII positioning. On September 11, Nifty recovered from an early fall but still closed at 23,398.10.
Why is Nifty falling today?
The main pressures are elevated crude oil prices, Middle East tensions, higher global bond yields and concerns about inflation and interest rates. Brent moved above $108 during the session.
What happens if crude oil crosses $110?
A sustained move above $110 could increase inflation and current-account concerns for India and potentially create additional pressure on the rupee, bonds and equities.
Are FIIs still selling Indian stocks?
Yes. On September 10, FIIs were net sellers of about ₹438 crore, while DIIs bought about ₹1,026 crore. This shows that domestic institutional liquidity is partly absorbing foreign selling.
What are the important Nifty levels?
For the current setup, 23,300 is an important decision zone, while 23,500–23,600 is a key recovery/resistance area. A sustained break below the lower support zone would weaken the recovery structure.
Why is the yen carry trade important for India?
If the Japanese yen strengthens sharply, global investors can unwind leveraged carry trades. That can lead to portfolio deleveraging and selling pressure across emerging markets, including India.
Will Nifty become bullish if it crosses 23,600?
A sustained breakout above 23,600 would improve the short-term structure, but confirmation would still require supportive crude prices, stable global yields and better FII participation.
SEO angle I would use
Main search intent:
“Why is Indian stock market falling/recovering today?”
Secondary intent:
“Nifty prediction + crude oil + FII DII + geopolitical news”
This is stronger than making the article only about the Iran-Israel conflict because today’s market data shows that crude, bond yields, currency and institutional flows are all interacting. Reuters specifically reported the Nifty’s three-month low, Brent above $108, India’s 10-year yield above 7%, and a fifth consecutive weekly decline.
Disclaimer
Disclaimer: This article is intended for educational and informational purposes only and should not be construed as investment advice, financial advice, trading advice, or a recommendation to buy or sell any security, index, commodity, currency, or financial instrument.
The market analysis, technical levels, scenarios, opinions, and interpretations presented in this article are based on publicly available information and are subject to change without notice. Financial markets, including Nifty, Bank Nifty, equities, derivatives, crude oil, currencies, and global markets, are highly volatile and involve substantial risk.
Past performance or historical market patterns do not guarantee future results. Any market levels or scenarios mentioned are indicative and not predictions or guarantees of future prices. Actual market movements may differ significantly due to geopolitical events, economic data, central-bank decisions, corporate developments, liquidity conditions, and other unforeseen factors.
Readers should conduct their own research and, where appropriate, consult a SEBI-registered investment adviser or qualified financial professional before making any investment or trading decision.
The author/publisher assumes no responsibility for any profit, loss, financial damage, or other consequences arising from the use of information contained in this article.
Investing and trading involve risk. Please make financial decisions based on your own risk tolerance, objectives, and independent research.
Top 10 SEO titles :
- India Stock Market Reversal: Why Nifty Is Recovering Despite Crude Oil Shock
- Nifty Today: Market Reversal, Crude Oil Surge, FII Selling and Geopolitical Risks Explained
- Why Is Nifty Falling and Recovering Today? Crude Oil, FII-DII and Global Market Analysis
- Indian Stock Market Outlook: Nifty, Bank Nifty, Crude Oil and FII-DII Flows Explained
- Nifty 50 Market Reversal: The Liquidity Trap Behind India’s Stock Market Rally
- India Stock Market Crash Risk: Crude Oil, US Yields, Rupee and FII Selling Explained
- Nifty Prediction: Will the Market Rally Continue or Face Another Sell-Off?
- Crude Oil at $110: Why India’s Stock Market Faces a Major Risk
- Nifty and Bank Nifty Outlook: Short Covering, FII Selling and the $110 Crude Oil Trigger
- The Liquidity Trap: Nifty Reversal, Crude Oil, Yen Carry Trade and Geopolitical Risk