
Why Is Gold Defying Financial Gravity?
Gold has entered one of the strangest phases in the modern financial market.
The textbook relationship is straightforward:
Interest rates rise → bond yields rise → gold becomes less attractive → gold falls.
But 2026 has repeatedly challenged that assumption.
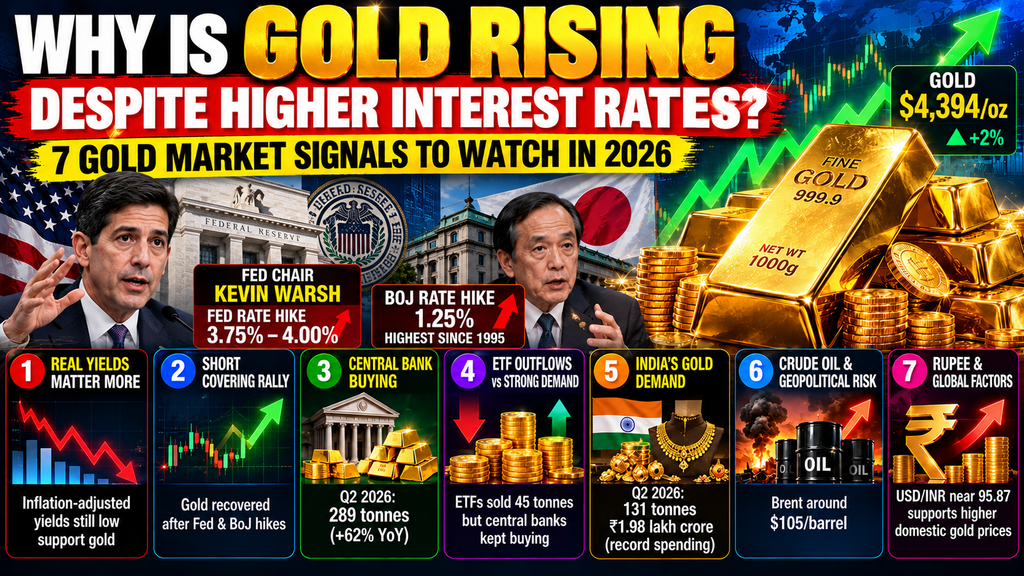
In September, the U.S. Federal Reserve raised its benchmark rate by 25 basis points to 3.75%–4.00%, while the Bank of Japan subsequently raised its policy rate to 1.25%, its highest level since 1995. Yet gold recovered sharply after initially falling, reaching approximately $4,394/oz on September 18.
That is the puzzle.
If two major central banks are tightening monetary policy, why isn’t gold simply collapsing?
The answer is that gold is no longer being driven by one variable.
Real interest rates, inflation expectations, central-bank reserve diversification, geopolitical risk, Asian demand, currency movements and ETF flows are all interacting.
And that creates seven important lessons for gold investors.
1. Gold Doesn’t Really Care About Headline Rates—It Cares About Real Rates
One of the biggest misconceptions about gold is that it simply moves inversely to interest rates.
The more useful measure is:
Real interest rate = Nominal interest rate − Inflation
Imagine a bank offers:
7% interest
while inflation is:
8%
Your nominal return is positive, but your inflation-adjusted return is approximately:
-1%
Gold becomes more attractive in environments where investors are worried that their real purchasing power is deteriorating.
This explains why a rate hike doesn’t automatically guarantee a gold sell-off.
The important questions are:
- Are inflation expectations rising?
- Are real yields rising?
- Is the dollar strengthening?
- Is crude pushing inflation higher?
- Is the central bank likely to continue tightening?
The September Fed decision is a good example. The Fed raised rates to 3.75%–4.00%, but subsequent movements in oil and Treasury yields changed the market’s interpretation of future real-rate pressure.
The key lesson:
Don’t watch the Fed rate alone. Watch the real-yield direction.
2. Gold’s September Rally Was Also a Positioning Story
The second lesson is about market positioning.
Ahead of the September Fed meeting, gold had already suffered a significant correction.
Spot gold fell to approximately $4,263/oz on September 15, before recovering toward $4,394 by September 18.
This is a classic example of:
“Sell the rumour, buy the news.”
Markets frequently move before major events because traders position themselves in advance.
A simplified sequence was:
Fed hike expectations
↓
Dollar/yield pressure
↓
Gold sell-off
↓
Fed announcement
↓
Some uncertainty removed
↓
Short covering + falling oil/yields
↓
Gold recovery
The lesson is important for traders.
A rate hike can be bearish before the announcement but less bearish—or even bullish—after the event if positioning was already extreme.
3. Central Banks Are Creating a Structural Gold Floor
This may be the most important long-term change in the gold market.
Central banks are not trading gold like short-term momentum traders.
They buy gold for:
- reserve diversification,
- geopolitical protection,
- currency diversification,
- long-term financial resilience.
According to the World Gold Council, central banks purchased approximately 289 tonnes of gold during Q2 2026, up 62% year-over-year and a record second-quarter total. H1 central-bank buying reached 345 tonnes.
That is a major structural demand source.
The World Gold Council also says 45% of central-bank survey respondents intend to increase their gold reserves over the next 12 months.
This changes the market equation.
Retail/ETF investors
More sensitive to:
- price,
- yields,
- momentum,
- dollar strength.
Central banks
More focused on:
- reserves,
- diversification,
- geopolitical risk,
- long-term purchasing power.
This creates what can be called:
The Gold Floor vs. Gold Ceiling
Structural Floor
Central-bank accumulation can absorb physical supply during corrections.
Overhead Ceiling
Investors who bought at very high prices can sell when gold returns toward their break-even levels.
That means gold can experience violent corrections without necessarily destroying its longer-term structural demand.
4. The ETF Story Is Completely Different
Another important piece of data comes from gold-backed ETFs.
The World Gold Council reported that gold ETFs experienced approximately 45 tonnes of outflows in Q2 2026. At the same time, central banks bought 289 tonnes.
This creates an interesting divergence:
ETF investors:
Selling
Central banks:
Buying
That helps explain why gold can remain structurally supported even when Western investment flows weaken.
The World Gold Council expects investment demand to remain an important driver through the second half of 2026, particularly through OTC activity and Asian buying, while ETF flows remain sensitive to real yields, monetary policy expectations and the U.S. dollar.
5. India’s Gold Market Is Sending Another Important Signal
India is particularly important because gold is not simply a financial asset here.
It is simultaneously:
- jewellery,
- savings,
- investment,
- wealth preservation,
- wedding expenditure,
- cultural asset.
According to the World Gold Council, Indian gold demand in Q2 2026 was approximately 131 tonnes, down 6% year-over-year.
But the value of that demand reached a record:
₹1,979 billion
or approximately:
₹1.98 lakh crore
because prices were substantially higher.
This is an extraordinary illustration of the price-volume relationship.
Volume ↓
but
Spending ↑
The World Gold Council reported that domestic gold prices remained approximately 59% higher year-over-year in Q2 2026.
So Indian consumers are buying less gold by weight but spending more money.
That is a very important structural signal.
6. India Has Another Gold Advantage: The Rupee
For Indian investors, the global gold price is only half the equation.
The domestic price is influenced by:
Global Gold Price
USD/INR
Import-related costs/taxes
Domestic premiums
Therefore:
Gold ↑ + Rupee ↓
can create a much larger increase in Indian gold prices than the international gold move alone.
Recent rupee weakness has therefore provided additional support to domestic gold prices.
Reuters reported the rupee around ₹95.87 per dollar in mid-September, while India’s 10-year benchmark government bond yield had moved above 7%.
This creates an important distinction:
Indian investors can see gold remain strong even when global gold is relatively flat if the rupee depreciates.
7. Crude Oil Creates a Strange Gold Paradox
Oil and gold may appear unrelated.
They aren’t.
Consider this chain:
Crude rises
↓
Inflation expectations rise
↓
Central banks remain hawkish.
↓
Real yields rise
↓
Gold faces pressure
That is the bearish channel.
But there is another channel:
Crude rises
↓
Geopolitical risk increases
↓
Safe-haven demand increases
↓
Gold receives support
So crude can simultaneously be:
Bearish for gold through interest rates
and
Bullish for gold through geopolitical risk.
This is why the relationship isn’t straightforward.
On September 25, Brent was around $105.45/barrel, according to market data reported by Moneycontrol.
The key question is therefore not simply whether oil rises.
It is:
Does the oil shock produce more inflation pressure or more safe-haven demand?
Whichever force dominates can influence gold’s next major move.
8. The Fed and BoJ Are Creating a New Global Rate Environment
The September monetary-policy sequence is historically interesting.
The Fed raised its policy range to:
3.75%–4.00%
while the Bank of Japan raised its policy rate to:
1.25%
the highest level since 1995.
The BoJ move matters because Japan has historically been associated with exceptionally low interest rates and yen-funded carry trades.
A higher Japanese policy rate potentially changes global capital flows.
For gold, the impact is indirect but important:
BoJ tightening
→ higher global funding costs
→ potential reduction in leveraged positions
→ higher volatility
→ increased demand for strategic reserve assets.
However, the BoJ rate hike alone should not be treated as a guaranteed gold catalyst.
9. Gold’s September Price Action Tells a Bigger Story
The recent price sequence is revealing.
September 15
Gold reached approximately:
$4,263/oz
September 18
Gold recovered toward:
$4,394/oz
September 21
Spot gold fell to approximately:
$4,349.94/oz
September 22
Gold slipped further toward:
$4,325/oz
Reuters attributed the weakness to expectations of prolonged restrictive U.S. monetary policy and a stronger dollar.
Then, by September 25, domestic spot gold was around:
₹1,51,377/10g
while October MCX futures were approximately:
₹1,51,710/10g.
This tells us something important:
Gold is volatile—but structural demand hasn’t disappeared.
10. Gold’s Biggest Enemy May Not Be Inflation
It may be:
A sustained rise in real yields.
This distinction is crucial.
If inflation rises but nominal yields do not rise sufficiently, real yields can remain low.
That can support gold.
But if:
Inflation ↓
Bond yields ↑
Dollar ↑
then real yields can rise significantly.
That combination would create a much more difficult environment for gold.
Therefore, investors should track:
U.S. 10Y Treasury yield
Inflation expectations
Dollar Index
Real yields
rather than simply watching the Fed headline rate.
11. Gold Supply Is Not Expanding Fast Enough to Eliminate the Structural Demand Story
Another underappreciated factor is supply.
World Gold Council data shows Q2 mine production increased approximately 2% year-over-year to 966 tonnes, a record second quarter.
But recycling declined approximately 6% year-over-year.
Why does recycling fall when gold prices are high?
Because many holders are reluctant to sell unless prices become extremely attractive.
This creates an unusual supply response:
Gold price ↑
but
Recycling does not necessarily surge proportionally.
That limits the amount of additional supply entering the market.
12. The Gold Market Has Two Completely Different Investors
The modern gold market increasingly resembles a battle between two investor groups.
| Short-Term Investors | Strategic Buyers |
|---|---|
| ETFs | Central Banks |
| Futures Traders | Sovereign Institutions |
| Momentum Traders | Reserve Managers |
| Yield-sensitive | Diversification-focused |
| Trade weeks/months | Think years/decades |
This explains why gold can experience a 10–20% correction and still retain a long-term bullish structural narrative.
One group responds to price.
The other responds to portfolio structure.
13. Three Gold Scenarios for Late 2026
Rather than making one fixed prediction, investors can think in scenarios.
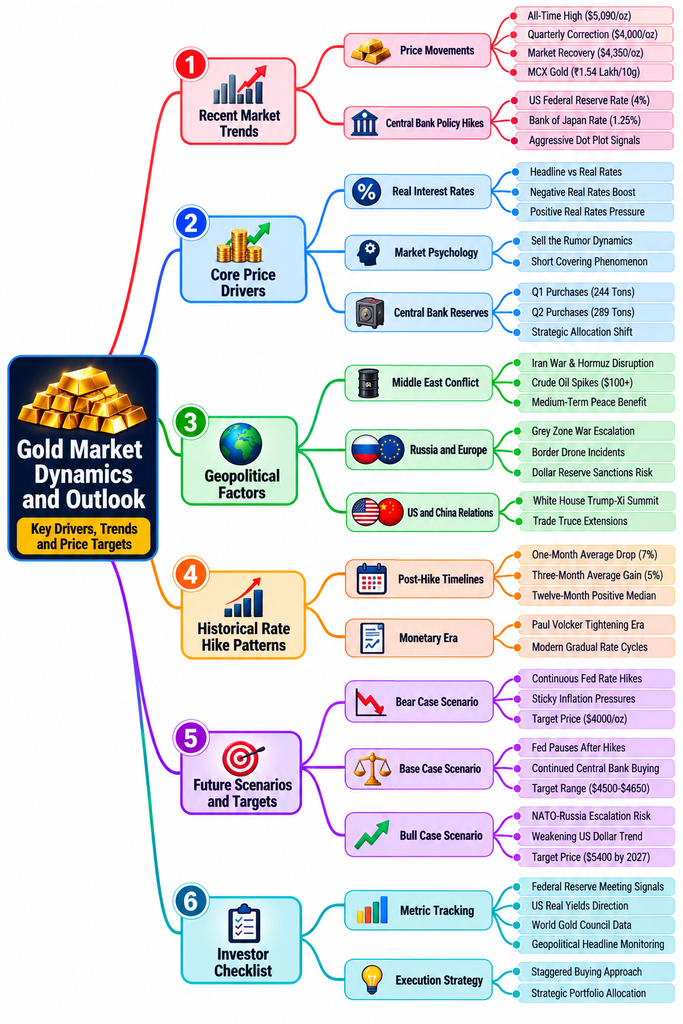
🔴 Bearish Scenario
Potential triggers:
- Fed remains aggressively hawkish
- U.S. real yields rise
- Dollar strengthens
- ETF outflows accelerate
- geopolitical risk premium declines
- central-bank purchases slow
The immediate technical zone to watch is around:
$4,250
A deeper correction could bring the market toward:
$4,000
The September 25 Indian market commentary also identified approximately ₹1.50 lakh/10g as an important domestic support area.
🟡 Base Scenario
Gold remains volatile but broadly supported.
Possible conditions:
- Fed eventually pauses
- real yields stabilize
- central banks continue buying
- Asian investment demand remains healthy
- geopolitical risks remain elevated but contained
The market could remain within a broad consolidation range before choosing a new direction.
For Indian investors, a sustained zone around:
₹1.50–1.54 lakh/10g
would become an important near-term reference based on current domestic market commentary.
🟢 Bullish Scenario
Gold could regain momentum if:
- real yields decline,
- the U.S. dollar weakens,
- geopolitical tensions intensify,
- central-bank purchases remain strong,
- Asian investment demand accelerates,
- or markets begin pricing a future easing cycle.
The original analysis cited institutional targets extending toward $4,500–$4,900 and beyond, but such forecasts should be treated as external analyst scenarios rather than guaranteed targets.
14. The Most Important Gold Dashboard for 2026
Instead of watching the gold price alone, investors should track this dashboard every week.
| Indicator | Bullish for Gold | Bearish for Gold |
|---|---|---|
| Real yields | ↓ | ↑ |
| US Dollar | ↓ | ↑ |
| Fed expectations | Dovish | Hawkish |
| Central-bank buying | ↑ | ↓ |
| ETF flows | Inflows | Outflows |
| Crude | Depends on cause | Inflation shock |
| Geopolitical risk | ↑ | ↓ |
| Asian demand | ↑ | ↓ |
| USD/INR | Rupee weaker | Rupee stronger |
| Gold price | Above support | Below support |
This is much more powerful than relying on a single indicator.
15. The Real Reason Gold Is Defying Financial Gravity
The answer is becoming clearer.
Gold isn’t simply trading against the Fed.
It is trading against a much larger macro system.
Old Gold Model
Rates ↑ → Gold ↓
Modern Gold Model
Real yields
Central-bank buying
Dollar
Geopolitics
Asian demand
ETF flows
Currency movements
Reserve diversification
=
Gold Price
That is why the traditional “rates up = gold down” rule is increasingly incomplete.
Conclusion: Gold Has Changed the Rules
The September 2026 gold market provides a powerful lesson.
The Fed raised rates.
The Bank of Japan raised rates.
Oil remained elevated.
The dollar strengthened at times.
Yet gold repeatedly found buyers.
The explanation isn’t that traditional economics has become completely irrelevant.
Rather, there are now additional forces powerful enough to offset the traditional rate headwind.
Central banks purchased 289 tonnes in Q2 2026, while global H1 gold demand reached 2,522 tonnes worth approximately $380 billion.
India’s Q2 gold demand was 131 tonnes, but spending reached a record ₹1.979 trillion, showing how dramatically higher prices are changing the economics of the Indian gold market.
Meanwhile, gold around $4,300–$4,400/oz remains highly sensitive to the next move in U.S. real yields, the dollar and Fed policy. September’s price action has already demonstrated how quickly gold can move when positioning and macro expectations change.
So the most important question for investors isn’t:
“Will interest rates make gold fall?”
It is:
“What happens to real yields, central-bank demand, the dollar and geopolitical risk simultaneously?”
That is the real equation driving the modern gold market.
📌 Gold Price Tracker: What to Watch Every Week
1. Fed: Is policy becoming more hawkish or dovish?
2. U.S. Real Yields: Rising or falling?
3. Dollar Index: Strengthening or weakening?
4. Central Banks: Are they still accumulating gold?
5. ETF Flows: Buying or selling?
6. Brent Crude: Is oil creating inflation pressure?
7. USD/INR: Is rupee depreciation supporting domestic gold?
8. MCX Gold: Holding ₹1.50 lakh or breaking below it?
9. Global Gold: Holding the $4,250 area or reclaiming $4,400?
10. Asian Demand: Is India/China investment demand accelerating?
FAQ: Gold Price, Fed Rates & Central Bank Buying
Is gold supposed to fall when interest rates rise?
Normally, higher real yields can create a headwind for gold because bullion doesn’t generate interest income. But nominal rate hikes alone don’t determine gold’s direction.
Why did gold rise after the Fed hike?
Positioning, changes in oil prices, and Treasury yields contributed to the recovery after the September Fed decision. Gold reached about $4,394/oz on September 18.
How much gold did central banks buy in Q2 2026?
Central banks bought approximately 289 tonnes in Q2 2026, according to the World Gold Council.
What is the current Indian gold price?
On September 25, domestic spot gold was approximately ₹1,51,377 per 10 grams, while October MCX futures were around ₹1,51,710.
Why does the rupee matter for Indian gold prices?
India imports most of its gold. Therefore, a weaker rupee can increase the domestic rupee price even if international gold prices remain relatively stable.
What is more important for gold: Fed rates or real yields?
Real yields are generally more informative because they account for inflation. A nominal rate hike does not necessarily mean real yields will rise by the same amount.
Can gold fall even if central banks continue buying?
Yes. Central-bank demand is an important structural factor, but gold can still experience significant corrections because of rising real yields, a stronger dollar, ETF selling, or profit-taking.
Is ₹1.50 lakh an important gold support?
Recent Indian market commentary identified approximately ₹1.50 lakh per 10 grams as an important near-term support zone.
⚠️ Disclaimer
This article is for educational and informational purposes only and does not constitute investment, financial,l or trading advice. Gold, MCX futures, ETFs and other commodities can be highly volatile. Price targets and bullish/bearish scenarios are analytical possibilities, not guaranteed outcomes.
Historical relationships between interest rates, real yields and gold prices can change. Central-bank purchases, geopolitical developments, currency movements and investor positioning can produce unexpected price movements.
Futures and options trading involves substantial risk and can result in significant financial loss. Investors should conduct their own research and consider consulting a SEBI-registered investment adviser before making investment decisions.
Past performance does not guarantee future results.
For educational purposes only. Not a buy/sell recommendation
🔥 Top 10 SEO Titles
- Why Is Gold Rising Despite Higher Interest Rates? 7 Gold Market Signals to Watch in 2026 ⭐
- Gold Price Outlook 2026: Why Gold Is Defying Higher Interest Rates
- Gold Price Prediction 2026: Fed Rates, Real Yields and Central Bank Buying Explained
- Why Gold Is Rising Despite Fed Rate Hikes: The Real Story Behind Gold Prices in 2026
- Gold Price in India 2026: What Real Yields, Rupee and Central Banks Mean for Investors
- Gold vs Interest Rates: Why Gold Can Rise Even When the Fed Is Tightening
- MCX Gold Forecast 2026: 7 Factors That Could Drive Gold Prices Higher or Lower
- Gold Price Outlook: Central Bank Buying, Fed Policy and Geopolitics Explained
- Is Gold Still a Safe Haven in 2026? Real Yields, Inflation and Global Risks Explained
- Gold at Record Levels: 7 Counter-Intuitive Reasons Behind the 2026 Gold Rally