
Nifty’s 7-Week Losing Streak: Is This a Crash or a Slow Bleed?
The Indian stock market has entered an unusual phase.
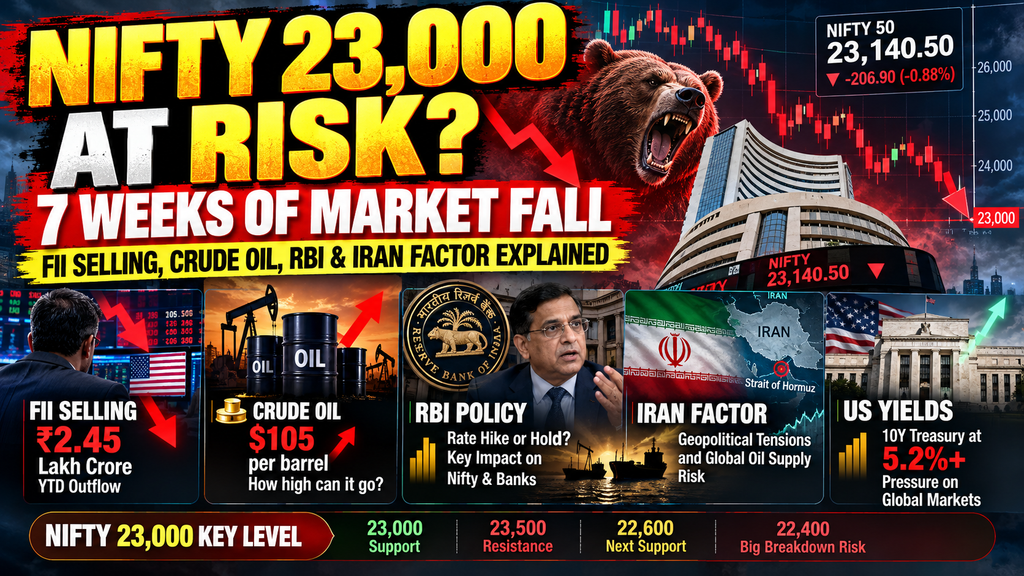
The Nifty 50 has now recorded seven consecutive weekly declines, its longest losing streak in six years. For the week ended September 25, 2026, Nifty closed at 23,140.50, down around 0.88% for the week. The index has fallen approximately 1,430 points, or 5.8%, over the seven-week slide.
This is not the kind of market decline that resembles the March 2020 crash.
There has been no single event equivalent to the pandemic shock. Instead, several pressures are working together:
- Elevated crude oil prices
- Higher global bond yields
- Foreign portfolio selling
- Rupee weakness
- Geopolitical uncertainty
- Pressure on IT and financial stocks
- Concerns over monetary policy
- Weakening technical momentum
The result is a market that has been grinding lower rather than collapsing in one session.
Your original draft describes this as a “slow bleed”—a prolonged erosion of market value rather than a single panic event.
1. Nifty 50: Seven Consecutive Weekly Losses
The numbers tell the story.
| Indicator | Latest Data |
|---|---|
| Nifty 50, Sep 25 | 23,140.50 |
| Weekly change | -0.88% |
| Consecutive weekly declines | 7 |
| Approx. fall over 7 weeks | ~1,430 points |
| Approx. drawdown | ~5.8% |
| Sep 24 fall | -1.64% |
| Sep 25 rebound | +0.34% |
The September 24 session was particularly important. Nifty dropped 1.64%, while the following day produced only a partial recovery.
Reuters reported that the seven-week losing streak was the longest in six years, while elevated crude prices and higher bond yields remained major concerns for investors.
This distinction matters.
A sharp crash can produce panic and capitulation quickly. A prolonged decline can instead create repeated attempts at recovery followed by renewed selling.
That is the structure traders need to watch now.
2. Nifty 23,000: The Most Important Technical Zone
The biggest technical question is simple:
Can Nifty defend 23,000?
The level has become an important psychological and technical reference.
Recent market commentary has identified 23,000 as immediate support, with the 23,000–23,200 region becoming an important zone for traders.
A useful framework is:
| Nifty Zone | Interpretation |
|---|---|
| Above 23,500 | Recovery structure improves |
| 23,300–23,500 | Initial resistance area |
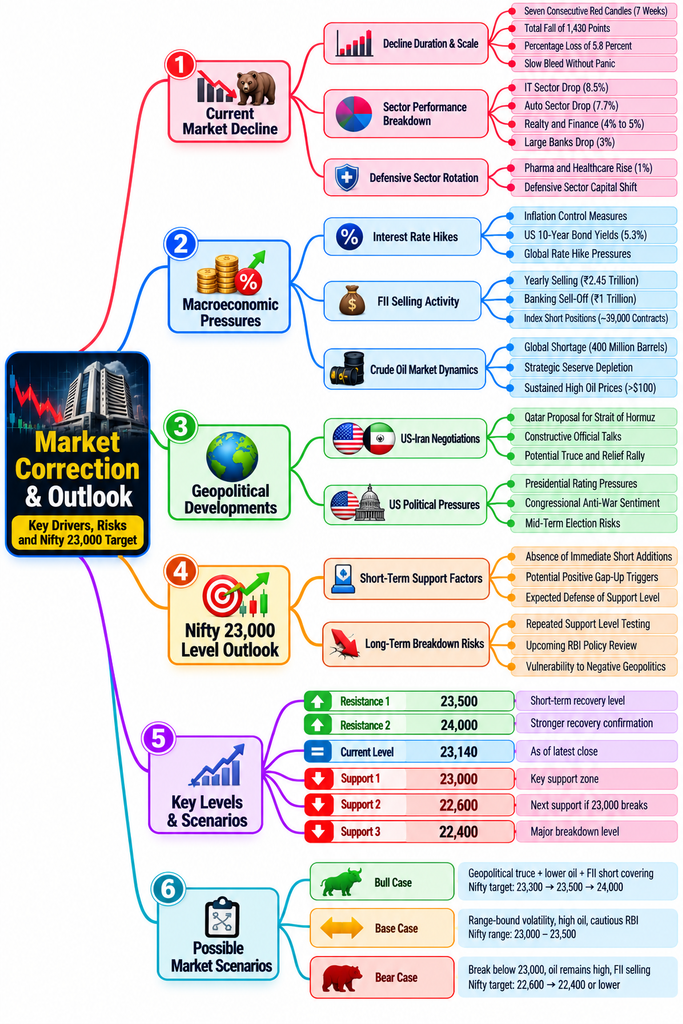
| 23,000–23,200 | Key support zone |
| Below 23,000 | Breakdown risk increases |
| 22,600–22,580 | Next technical reference |
| Below 22,580 | 22,400 becomes another downside reference |
These are technical reference levels, not guaranteed targets.
One market analyst cited by New Indian Express identified 23,000 as immediate support and 22,600–22,580 as the next downside zone if that support fails; the same analysis placed 23,500 as an important level for improving the short-term structure.
3. The FII Selling Story Is Bigger Than the Daily Nifty Move
One of the strongest forces behind the weakness has been foreign selling.
Your draft puts cumulative 2026 FII equity distribution at approximately ₹2.45 lakh crore, with a particularly large amount attributed to financial stocks.
Recent September data also confirms the broad direction.
Reports citing NSDL data showed that foreign investors had withdrawn roughly ₹20,974 crore from Indian equities during September, while calendar-year 2026 outflows remained around ₹2.45 lakh crore.
At the same time, domestic institutions have been acting as an important counterweight.
This creates an important market dynamic:
FII selling → DII buying → index decline becomes slower rather than disappearing.
That helps explain why the market can remain weak without experiencing a complete collapse.
4. FII Futures Positioning: One Important Data Correction
Your original draft says:
FII index shorts have reached approximately 390,000 contracts.
However, the latest participant-wise index-futures data available for September 25, 2026 shows FII net index futures positioning at approximately -312,001 contracts.
So for an SEO article, I would not publish 390,000 as the latest confirmed number.
Instead:
Latest available snapshot
FII net index futures: -312,001 contracts
That is still a very large net-short position and is an important risk indicator, but it should not automatically be interpreted as proof that FIIs “know something.”
Futures can represent directional bets, hedges, portfolio protection,n and other positioning.
5. Why Crude Oil Is Becoming a Major Problem for India
For India, crude oil is particularly important because higher oil prices can affect:
- Import costs
- Current-account dynamics
- Inflation
- Rupee pressure
- Corporate input costs
- Transportation expenses
- Bond yields
- RBI policy expectations
During the week ending September 25, Brent crude remained around $105 per barrel, while market participants continued to watch Middle East developments closely.
This creates a potentially uncomfortable chain:
Geopolitical tension
↓
Higher crude oil
↓
Higher inflation expectations
↓
Higher bond yields
↓
Tighter financial conditions
↓
Pressure on equity valuations
This is one of the central macroeconomic themes behind the current market weakness.
6. US Treasury Yields Are Another Pressure Point
Crude oil is not operating alone.
US Treasury yields have also become an important factor for emerging markets.
Recent market reports noted the US 10-year Treasury yield moving above 5.10% during the week, increasing pressure on global financial conditions.
For Indian equities, the concern is straightforward.
When US yields rise significantly:
US assets become relatively more attractive
→ global capital can become more selective
→ emerging-market currencies can face pressure
→ FII flows can weaken
→ equity valuations may come under pressure.
This does not mean every rise in US yields automatically causes an Indian market decline, but the combination of high crude + high US yields + foreign selling is particularly important.
7. RBI’s Policy Dilemma
The uploaded draft describes an RBI “Catch-22” situation.
The basic problem is genuine:
Scenario A — RBI becomes more hawkish
Higher rates could help address inflation and currency pressure.
But higher domestic rates can also put pressure on:
- Banks
- Auto
- Realty
- Consumer demand
- Equity valuations
Scenario B — RBI remains accommodative
Keeping rates lower can support domestic growth.
But if global yields and crude remain elevated, the rupee can remain under pressure and imported inflation risks can increase.
The latest inflation data makes this debate more important.
India’s August 2026 CPI inflation was 4.82%, up from 4.45% in July. Food inflation was 5.95%.
The RBI’s policy rate was reported at 5.25%, while market participants were increasingly discussing the possibility of an October rate move.
The October MPC meeting is scheduled for October 5–7, according to market reporting.
Therefore, October policy becomes an important event risk for Indian markets.
8. The Iran Factor: Why Oil and Geopolitics Matter
Your original article identifies Iran and the Strait of Hormuz as a potential catalyst for market relief.
There have indeed been reports about possible diplomatic developments involving Iran and the Strait of Hormuz.
Reuters reported on September 22 that oil prices declined after reports that Iran might reopen the Strait of Hormuz if US military pressure was reduced, with markets interpreting the development as potentially supportive of diplomatic talks.
The market mechanism is important:
If tensions ease:
Lower geopolitical risk
↓
Lower oil risk premium
↓
Lower inflation pressure
↓
Potential relief in bond yields
↓
More RBI policy flexibility
↓
Potential short covering
This is a scenario, not a forecast.
Likewise, if geopolitical tensions intensify, the reverse mechanism could put additional pressure on Indian equities.
9. Why a Peace Deal Does Not Necessarily Mean Oil Falls to $60
The uploaded draft argues that even if geopolitical tensions ease, crude oil may not immediately collapse to $60–65 because physical supply constraints, strategic-reserve replenishment and shipping risks can persist.
This is an important distinction.
Geopolitical premium ≠ entire oil price.
Even if the geopolitical premium disappears, crude prices can remain elevated because of:
- Production constraints
- Inventory levels
- Refinery capacity
- Shipping insurance
- Supply-chain disruptions
- Strategic reserve rebuilding
- Demand conditions
Therefore:
Peace → potentially lower oil
does not necessarily mean:
Peace → $60 crude immediately.
10. IT and Financial Stocks Are Carrying Much of the Pressure
The weakness has not been evenly distributed.
Your draft identifies IT, automobiles, realty/financials and large banks among the weaker segments, while pharma and healthcare were relatively more resilient.
More recent weekly data shows:
| Sector | Recent Weekly Trend |
|---|---|
| Nifty IT | -2.4% |
| Nifty Private Bank | -1.5% |
| Nifty Energy | ~ -1% |
| Nifty Realty | ~ +3% |
| Pharma | ~ +1% |
| FMCG | ~ +1% |
These figures show why looking only at the Nifty can sometimes hide the underlying rotation.
IT is sensitive to global growth, US rates, ES, and earnings expectations.
Financial stocks are sensitive to:
- Interest rates
- Credit growth
- Bond yields
- Valuations
- Regulatory changes
- Foreign portfolio flows
That makes both sectors important for the next market phase.
11. Nifty 23,000: Bounce or Breakdown?
This is where technical and fundamental data collide.
Bullish scenario
If:
- Nifty holds 23,000
- Crude falls
- US yields ease
- FII short covering begins
- Bank Nifty stabilises
- Geopolitical tensions decline
then a technical relief rally could develop.
The first major reference would be the 23,300–23,500 region.
A sustained move above 23,500 would represent an improvement in the short-term technical structure, according to recent analyst commentary.
Bearish scenario
If:
- 23,000 breaks decisively
- Crude remains above $100
- US yields stay elevated
- Rupee pressure continues
- FII selling persists
then the market could test lower technical zones.
22,600–22,580 is one important reference, followed by approximately 22,400 in a deeper breakdown scenario.
These are scenarios, not predictions.
12. The Most Important Market Dashboard for October
Instead of watching Nifty alone, traders can track this dashboard:
| Indicator | Why It Matters |
|---|---|
| Nifty 23,000 | Major technical support |
| Nifty 23,500 | Recovery confirmation zone |
| Brent crude | Inflation and import-cost pressure |
| US 10Y yield | Global liquidity/valuation pressure |
| USD/INR | Foreign-flow and imported inflation signal |
| FII cash flows | Foreign institutional demand/supply |
| FII index futures OI | Derivatives positioning |
| Bank Nifty | Financial-sector confirmation |
| India VIX | Volatility expectations |
| RBI policy | Domestic liquidity and rate direction |
| Middle East developments | Oil/geopolitical risk |
This gives a much better picture than relying on a single indicator.
13. Three Possible Paths for Nifty
🟢 Scenario 1: Relief Rally
Possible triggers:
- Oil falls
- Geopolitical tensions ease
- US yields decline
- FII shorts cover
- Bank Nifty stabilises
Possible market behaviour:
23,000 holds → 23,300 → 23,500 becomes the key test.
🟡 Scenario 2: Sideways Volatility
Possible triggers:
- Oil remains around elevated levels
- FII selling slows but doesn’t reverse
- RBI remains cautious
- Global yields remain high
Possible behaviour:
23,000–23,500 range with high volatility.
🔴 Scenario 3: Breakdown
Possible triggers:
- 23,000 fails decisively
- Crude rises again
- US yields remain elevated
- FII selling accelerates
- Rupee weakens
Possible technical references:
22,600 → 22,580 → 22,400
Again, these are scenario levels rather than guaranteed targets.
14. What Investors Should Watch Before Taking a Position
The current environment argues for monitoring rather than relying on one headline.
Daily checklist
1. Nifty
- Is 23,000 holding?
2. Bank Nifty
- Is financial-sector selling slowing?
3. Crude
- Is Brent above or below $100–105?
4. US 10Y
- Are yields rising or falling?
5. USD/INR
- Is the rupee stabilising?
6. FII
- Are cash-market outflows slowing?
7. Futures
- Are FII net shorts increasing or decreasing?
8. RBI
- Are policy expectations becoming more hawkish?
9. Geopolitics
- Are oil-supply risks increasing or decreasing?
Final Verdict: The 23,000 Battle Is About More Than Technicals
The current Indian market weakness is not being driven by one factor.
It is the combination of:
FII selling + high crude + elevated US yields + rupee pressure + geopolitical uncertainty + weak technical momentum.
The seven-week losing streak makes the 23,000 Nifty zone particularly important, but the level itself cannot be viewed in isolation.
If crude and global yields ease while FII selling slows, the market could see a technical relief move.
If oil rises again, global yields remain elevated and 23,000 breaks decisively, the next technical support zones become increasingly relevant.
The key question for October is therefore not simply:
“Will Nifty fall or rise?”
It is:
“Which macro variable changes first—oil, yields, FII flows or geopolitics?”
That variable could determine whether 23,000 becomes a base for recovery or a level that eventually gives way.
FAQ
Is Nifty 23,000 a strong support?
23,000 is currently being widely watched as an important technical support zone. A decisive break could increase downside risk, while holding the level could support a short-term recovery attempt.
Why is the Indian stock market falling?
The current weakness reflects a combination of elevated crude oil prices, higher global yields, foreign selling, rupee pressure and geopolitical uncertainty.
Are FIIs heavily short on Nifty?
Yes, the latest participant-wise data available for September 25 showed FIIs with approximately 312,001 net short index-futures contracts.
Can FII short covering cause a Nifty rally?
If prices rise while large short positions are closed, short covering can amplify an existing rebound. However, short positions alone do not guarantee a rally.
What happens if Nifty breaks 23,000?
Recent technical analysis has identified approximately 22,600–22,580 as the next important reference zone, with 22,400 another downside level in a deeper decline scenario.
Why is crude oil so important for India?
India is highly sensitive to imported energy costs. Higher crude can pressure inflation, the rupee, corporate costs, and monetary-policy expectations.
Disclaimer: This article is for educational and informational purposes only and is not investment, trading or financial advice. Technical levels and market scenarios are not guaranteed outcomes. F&O trading involves substantial risk. Investors should conduct their own research and consider consulting a SEBI-registered investment adviser before making investment decisions.
Top 10 SEO Titles
- Nifty 23,000 at Risk? 7-Week Market Fall, FII Selling, Crude Oil and RBI Factor Explained
- Nifty 50 Outlook 2026: Why the Market Has Fallen for 7 Straight Weeks
- Nifty 23,000 Support: FII Short Positions, Crude Oil and US Yields Explained
- Why Is Nifty Falling? 7 Weeks of Losses, FII Selling and the Iran Oil Factor
- Indian Stock Market Crash or Slow Bleed? Nifty 23,000 and FII Selling Explained
- Nifty 50 at 23,000: Can FII Short Covering Trigger a Market Relief Rally?
- FII Selling Hits ₹2.45 Lakh Crore: Why Nifty 23,000 Is Now Critical
- Nifty October 2026 Outlook: RBI Policy, Crude Oil, FII Shorts and 23,000 Support
- 7 Weeks of Red: What Is Driving the Nifty Fall and How Low Could It Go?
- Nifty Market Analysis 2026: FII Selling, US Yields, Crude Oil and Key Support Levels