

1. Introduction: Is India’s SIP Boom Making the Stock Market More Vulnerable?
For millions of Indian households, Systematic Investment Plans (SIPs) have become an important way to invest regularly in mutual funds. By investing a fixed amount at predetermined intervals, investors can build financial discipline without attempting to predict every market movement.
The growth has been remarkable.
According to the Association of Mutual Funds in India (AMFI), monthly SIP contributions reached a record ₹32,490 crore in September 2026. The number of outstanding SIP accounts stood at approximately 10.89 crore, while contributing SIP accounts reached around 10.06 crore.
These figures demonstrate the growing importance of domestic savings in India’s financial markets.
However, a larger domestic investor base does not eliminate market risk. Stock prices can still decline when valuations become excessive, earnings disappoint, liquidity deteriorates, or global conditions change suddenly.
The central question is not whether SIPs are good or bad. It is whether investors understand the risks associated with the market in which their money is being invested.
During periods of heavy foreign institutional selling, domestic institutions can provide an important counterbalance. Yet their buying cannot guarantee that stock prices will remain stable, particularly when earnings expectations weaken, or investors become less willing to pay high valuations.
This article examines five important risks behind India’s SIP-driven investment boom, using available market data to separate genuine vulnerabilities from exaggerated crash predictions.
2. Five Surprising Risks Behind India’s SIP Boom
Risk 1: Domestic Investors Are Becoming More Important—But They Cannot Eliminate Market Corrections
One of the biggest changes in India’s equity market is the increasing ownership share of domestic institutions.
According to the NSE’s ownership data for the June 2026 quarter, domestic institutional investors (DIIs) held approximately 19.5% of NSE-listed companies by market capitalisation, compared with around 15.1% for foreign portfolio investors (FPIs).
Domestic mutual funds have also increased their presence in Indian equities, supported in part by regular household investments and other institutional inflows.
This represents an important structural change: India’s stock market is becoming less dependent on foreign investors as the only major source of institutional demand.
But there is a potential vulnerability.
What happens when foreign investors sell?
Foreign investors may sell Indian equities for several reasons, including:
- Higher interest rates or bond yields in developed markets.
- A stronger US dollar.
- Geopolitical uncertainty.
- Currency depreciation.
- Concerns about Indian equity valuations.
- More attractive investment opportunities in other markets.
Domestic institutions may purchase shares sold by foreign investors. However, this does not mean they will always buy enough to prevent a correction.
For example, a mutual fund manager may reduce exposure to an expensive stock even while receiving new SIP contributions. An insurance company may have different allocation requirements from an equity mutual fund. A domestic institution may also need to retain cash for redemptions or other obligations.
There is no guarantee that every rupee of foreign selling will be matched by an equivalent domestic purchase at the same price.
The latest market example
On October 26, 2026, foreign institutional investors were reported as net sellers of approximately ₹1,462.49 crore in the cash market, while domestic institutional investors were net buyers of approximately ₹2,609.57 crore.
The contrast illustrates the role of domestic investors in absorbing selling pressure. Nevertheless, a single day’s figures cannot establish whether institutional flows will remain supportive over the coming weeks.
Investor takeaway: Domestic ownership can make the market more resilient to foreign outflows, but it cannot create a permanent safety net against falling earnings, expensive valuations or widespread selling.
Risk 2: Record SIP Inflows Do Not Automatically Justify Higher Stock Valuations
A second concern is the relationship between regular investment flows and equity valuations.
When investors contribute money to mutual funds every month, fund managers must manage those inflows according to the schemes’ investment mandates, portfolio allocation rules and cash-management decisions.
Equity funds may invest new money in stocks, retain some cash where appropriate or adjust their existing portfolios.
However, SIP inflows do not force every fund manager to buy every stock immediately, regardless of valuation.
The important issue is whether the prices investors pay for shares are supported by future earnings and cash flows.
SIP growth in numbers
| Indicator | Latest available figure |
|---|---|
| Monthly SIP contribution, September 2026 | ₹32,490 crore |
| Outstanding SIP accounts | Approximately 10.89 crore |
| Contributing SIP accounts | Approximately 10.06 crore |
| SIP contribution, August 2026 | ₹32,297 crore |
| SIP contribution, September 2025 | ₹29,361 crore |
| SIP assets under management, September 2026 | Approximately ₹17.86 lakh crore |
Source: AMFI’s September 2026 mutual fund data.
Monthly SIP contributions increased from ₹29,361 crore in September 2025 to ₹32,490 crore in September 2026. This represents year-on-year growth of approximately 10.7%.
The figures demonstrate the growing scale of systematic investing. They do not, by themselves, establish whether the overall equity market is overvalued.
How can valuations become stretched?
Suppose a company earns ₹100 per share and trades at ₹2,000. Its price-to-earnings ratio is 20.
If investors become increasingly optimistic and the share price rises to ₹3,000 while earnings remain unchanged, the P/E ratio increases to 30.
The company may still be a good business, but investors are paying a higher price for the same current earnings.
If earnings subsequently disappoint, the market may reduce the valuation multiple. The share price can then fall even if the business remains profitable.
This is why investors should distinguish between three different developments:
- Growing investment flows: More money is entering mutual funds.
- Improving business performance: Companies are generating higher earnings and cash flows.
- Expanding valuations: Investors are willing to pay more for each unit of earnings.
These factors can move together, but they are not interchangeable.
Is there a circular buying loop?
Domestic mutual funds can buy shares sold by other investors, including other domestic institutions. This is a normal feature of secondary-market trading.
It would be misleading, however, to conclude that the entire market operates through a closed DII-to-DII trading loop or that SIP inflows have no connection with corporate earnings.
Share prices are determined by the interaction of buyers and sellers, their expectations,s and the prices at which they are willing to transact.
Over the long term, corporate earnings and cash generation remain important drivers of sustainable equity returns.
Investor takeaway: Strong SIP inflows support investment demand, but they are not a substitute for earnings growth, reasonable valuations and sound business fundamentals.
Risk 3: Mid-Cap and Small-Cap Stocks Can Face Greater Liquidity Pressure During a Sell-Off
Mid-cap and small-cap stocks can offer opportunities for long-term investors, but their liquidity characteristics differ from those of heavily traded large-cap companies.
A stock may trade comfortably during normal market conditions and become much harder to sell when many investors attempt to exit simultaneously.
This is particularly important for mutual funds that manage substantial assets relative to the trading volume of their underlying holdings.
What does liquidity risk mean?
Liquidity risk arises when an investor cannot sell an asset quickly at a reasonable price.
Consider a hypothetical small-cap stock trading at ₹500.
If buyers are available near ₹500, a seller may exit without a large price impact. But if selling pressure increases and available buy orders disappear, the seller may have to accept ₹480, ₹4,50 or a lower price to complete the transaction.
The problem is not necessarily that the company’s fundamental value has fallen by the same amount. It is that the market is temporarily unable to absorb the selling volume without a significant price adjustment.
This risk can become more pronounced when:
- Trading volumes are low.
- Bid-ask spreads widen.
- Several large holders attempt to sell together.
- Earnings disappoint.
- Investors reduce exposure to risky assets.
- Leveraged traders are forced to close positions.
Circuit limits can further restrict the ability to execute transactions at a desired price.
However, not every mid-cap or small-cap stock is illiquid, and a sharp decline does not automatically indicate that a company is fundamentally weak.
What do mutual fund stress tests show?
AMFI publishes liquidity stress-test disclosures for mid-cap and small-cap mutual fund schemes.
These disclosures estimate how long a fund might need to sell specified portions of its portfolio under a defined methodology.
According to data reported in October 2026, the average small-cap fund would take approximately 11.9 trading days to sell half its portfolio under the September stress-test assumptions, compared with 18.8 days in January 2026.
The estimated time to sell one-quarter of the portfolio fell to approximately 6.2 days from 9.6 days over the same period.
These figures indicate an improvement in the reported liquidity measures, rather than evidence of a worsening industry-wide liquidity crisis.
But there is an important limitation: the results are estimates based on specified trading assumptions and historical volumes. Actual liquidation during a severe market panic could take longer or require accepting lower prices.
Why should retail investors care?
Mutual fund liquidity can influence portfolio management during periods of heavy redemptions.
If a fund needs cash, it may sell some holdings. The impact on a particular stock depends on its trading volume, the size of the sale and the availability of buyers.
Investors should therefore avoid assuming that every small-cap fund will be forced to sell everything simultaneously. They should also avoid assuming that normal-market liquidity will remain unchanged during a crisis.
Investor takeaway: Small-cap investing requires greater attention to valuation, trading liquidity and portfolio concentration. Review a fund’s risk disclosures rather than relying exclusively on its historical returns.
Risk 4: SIP Cancellations and Slower Registrations Deserve Attention—But Do Not Prove the SIP Boom Is Ending
Another important indicator is the number of investors continuing their existing SIPs relative to those registering new plans or discontinuing previous ones.
A rise in SIP cancellations may reflect financial pressure, changing investment preferences, completed investment tenures or dissatisfaction with returns. The reason cannot be determined from cancellation figures alone.
AMFI’s September 2026 data showed:
| SIP Indicator | September 2026 |
|---|---|
| New SIP registrations | Approximately 63.26 lakh |
| SIPs discontinued or completed | Approximately 49.68 lakh |
| Outstanding SIP accounts | Approximately 10.89 crore |
| Monthly SIP contributions | ₹32,490 crore |
New SIP registrations declined from approximately 66.40 lakh in August to 63.26 lakh in September. The number of SIPs discontinued or completed also declined, from approximately 53.82 lakh to 49.68 lakh.
The SIP stoppage ratio fell to 78.5% in September from 81.1% in August, according to industry reporting.
This distinction is important. A decline in new registrations does not necessarily mean that total contributions are falling. Existing investors may increase their instalments, and new investors may contribute different amounts from those discontinuing their plans.
Indeed, September’s monthly contribution was higher than August’s.
What could cause SIP participation to weaken?
Several factors may influence investor behaviour:
- Household income pressure and rising living costs.
- Poor recent investment returns.
- Uncertainty about employment or business income.
- Changes in financial goals.
- A shift towards debt funds or other asset classes.
- Investors pausing or cancelling investments after market volatility.
A sustained reduction in contributions could affect the pace of new investment demand. However, one month’s data is not sufficient to establish a long-term reversal.
Investors should examine contribution amounts, outstanding accounts, contributing accounts, new registrations and discontinued SIPs over several months.
Should investors stop their SIPs during a correction?
Not automatically.
A SIP is a method of investing regularly, not a guarantee of profit. Its suitability depends on the investor’s time horizon, financial goals, emergency savings, and ability to tolerate losses.
For a long-term investor whose circumstances have not changed, a market correction may mean that a fixed contribution purchases more mutual fund units. It does not guarantee that the investment will recover quickly or that every underlying stock is attractively valued.
Investors who need money soon or cannot tolerate further losses may need a different asset allocation.
Investor takeaway: Monitor the direction of SIP data, but do not interpret every fluctuation in registrations as evidence of an imminent stock market crash.
Risk 5: High Volatility, Global Uncertainty and Expensive Equities Can Combine to Increase Portfolio Risk
India’s domestic investment flows are only one part of the market equation.
Global interest rates, crude oil prices, currency movements and geopolitical developments can affect Indian equity valuations and foreign investor behaviour.
These risks become especially important when investors are paying high valuations for companies whose earnings may be sensitive to economic conditions.
Current market snapshot: October 27, 2026
| Market Indicator | Latest Available Reading | Why It Matters |
|---|---|---|
| Nifty 50 close | 22,749.75 | Benchmark for assessing the broader equity market |
| Sensex close | 73,598.67 | Major large-cap market indicator |
| India VIX close | Approximately 16.40 | Indicates expected near-term volatility |
| Brent crude | Around US$115–116 per barrel | Higher oil prices can pressure India’s import bill and inflation |
| FII cash-market activity, October 26 | Net selling of approximately ₹1,462.49 crore | Shows foreign selling pressure in that session |
| DII cash-market activity, October 26 | Net buying of approximately ₹2,609.57 crore | Shows domestic institutional buying in that session |
Source: Market reporting published on October 27, 2026, and historical India VIX data.
On October 27, the Nifty closed at 22,749.75, down 0.02%, while the Sensex fell 0.01%. The benchmark indices finished nearly unchanged despite fluctuations during the session.
India VIX closed at approximately 16.40, down from around 17.16 on October 26. The decline suggests that the market’s volatility gauge eased during the latest session, although it remained an important indicator to monitor.
Brent crude continued to trade near US$116 per barrel amid geopolitical concerns. Elevated oil prices can increase costs for energy-intensive businesses and place pressure on India’s inflation outlook.
Investors were also watching the US Federal Reserve’s policy decision scheduled for October 28.
These developments can affect equity markets through several channels:
Interest rates: Higher global yields can make some fixed-income assets more attractive relative to equities.
Currency movements: A stronger dollar or a weaker rupee can influence foreign investment returns and import costs.
Corporate earnings: Higher input costs can reduce margins for companies unable to pass those costs on to customers.
Valuations: If investors demand a higher return for taking equity risk, they may become less willing to pay elevated valuation multiples.
Investor sentiment: Uncertainty can increase demand for hedging and lead to wider price swings.
Why the combination matters
Imagine a company trading at a premium valuation because investors expect strong earnings growth.
If crude oil rises sharply, borrowing costs remain high,h and the company reports disappointing results, investors may lower their earnings forecasts and valuation multiple simultaneously.
That combination can produce a substantial price decline.
But the opposite can also occur. If earnings exceed expectations and macroeconomic pressures ease, a highly valued company may continue to perform well.
Investor takeaway: Do not base portfolio decisions exclusively on SIP inflows or FII selling. Consider valuations, earnings, global conditions, ns and your investment horizon together.
3. Does India’s SIP Boom Guarantee a Stock Market Bubble?
No. Rising SIP inflows do not automatically mean that Indian equities are in a bubble.
A bubble is generally associated with prices becoming detached from reasonable expectations of future cash flows or economic value, often alongside excessive speculation and unrealistic assumptions.
SIP inflows can support demand, but determining whether the market is overvalued requires additional evidence.
Investors should examine several indicators.
Valuation Measures
Price-to-earnings ratio (P/E): Compare current valuations with historical levels, earnings gro, wth and the company’s sector.
Price-to-book ratio (P/B): This can be useful for financial companies and businesses where book value is economically meaningful.
Earnings growth: Determine whether projected earnings growth is supported by revenue, margins and realistic business assumptions.
Free cash flow: Check whether reported profits translate into cash after capital expenditure.
Return on equity (ROE): Examine profitability relative to shareholders’ capital, while considering leverage and accounting differences.
No single ratio can determine whether a stock is cheap or expensive in every situation.
Market-Wide Indicators
Investors can also monitor:
- Market concentration in a small number of large companies.
- IPO pricing and post-listing performance.
- Small-cap and mid-cap valuations relative to earnings.
- Mutual fund flows and redemption trends.
- Foreign and domestic institutional ownership.
- Corporate earnings revisions.
- Trading volumes and market breadth.
A market can experience strong inflows and reasonable valuations simultaneously. Likewise, a market can decline despite continued inflows if earnings disappoint or investors reduce the prices they are willing to pay.
The correct approach is to evaluate the evidence rather than assume that a record inflow figure proves either a bubble or a healthy market.
4. How Retail Investors Can Protect Their Portfolios
Investors do not need to predict the next crash to manage risk more effectively.
A disciplined investment process can help reduce the impact of excessive valuations, concentrated exposure and emotional decision-making.
Strategy 1: Match Asset Allocation to Your Financial Goals
Money needed for near-term expenses should not automatically be invested in volatile equities.
Before increasing equity exposure, consider your investment horizon, emergency savings, income stability and ability to tolerate losses.
Strategy 2: Diversify Beyond a Single Market Segment
A portfolio concentrated in small-cap or thematic stocks may be more vulnerable than a diversified portfolio.
Diversification across appropriate asset classes, sectors and investment styles can reduce concentration risk. However, diversification cannot eliminate market-wide losses.
Strategy 3: Review the Underlying Companies
For direct equity investments, evaluate:
- Revenue and earnings growth.
- Debt and interest coverage.
- Operating cash flow.
- Return on invested capital.
- Promoter pledging and governance concerns.
- Competitive advantages.
- Valuation relative to realistic earnings expectations.
A rising stock price is not sufficient evidence of business quality.
Strategy 4: Understand Your Mutual Fund’s Risk Profile
Before investing in a small-cap or mid-cap fund, review its investment mandate, portfolio concentration, expense ratio, historical volatility and published liquidity stress tests.
Different funds within the same category can have materially different portfolios and risk characteristics.
Strategy 5: Avoid Panic-Based Decisions
Sharp market declines can create pressure to sell everything, while strong rallies can encourage investors to chase expensive stocks.
Both decisions can be harmful when they are inconsistent with the investor’s financial goals.
Review your portfolio when your circumstances, risk tolerance, or investment objectives change. Do not change a long-term plan solely because of a single market headline.
Strategy 6: Treat Derivatives as High-Risk Instruments
Futures and options can magnify losses, particularly when positions are leveraged or held during volatile events.
Investors should understand position sizing, margin requirements, expiry effects, implied volatility, and the possibility of gaps in the underlying market.
Derivatives should not be used as a substitute for a well-defined investment plan.
5. What Investors Should Monitor in the Coming Months
The following indicators can help investors assess whether India’s domestic investment demand remains resilient.
| Indicator | What to Monitor | Potential Warning Sign |
|---|---|---|
| Monthly SIP contributions | Contribution trend across several months | Persistent declines alongside weaker participation |
| Contributing SIP accounts | Number of accounts making instalments | Sustained reductions rather than one-month fluctuations |
| SIP discontinuations | Changes in closures and completed tenures | Rising stoppages combined with falling contributions |
| FII and DII flows | Net activity across multiple sessions and quarters | Persistent outflows without sufficient offsetting demand |
| Equity valuations | P/E, P/B and earnings expectations | Rising prices without corresponding fundamental improvement |
| Corporate earnings | Revenue, margins and cash flow | Repeated earnings downgrades |
| Small-cap liquidity | AMFI stress-test disclosures and trading volumes | Deteriorating liquidity measures |
| India VIX | Direction and magnitude of implied volatility | A sharp rise alongside falling prices |
| Crude oil | Price trend and supply disruptions | Sustained high prices that pressure inflation and margins |
| Global interest rates | Central-bank decisions and bond yields | Tighter financial conditions and reduced risk appetite |
These are monitoring indicators, not guaranteed market-timing signals. Their significance depends on the broader economic and financial environment.
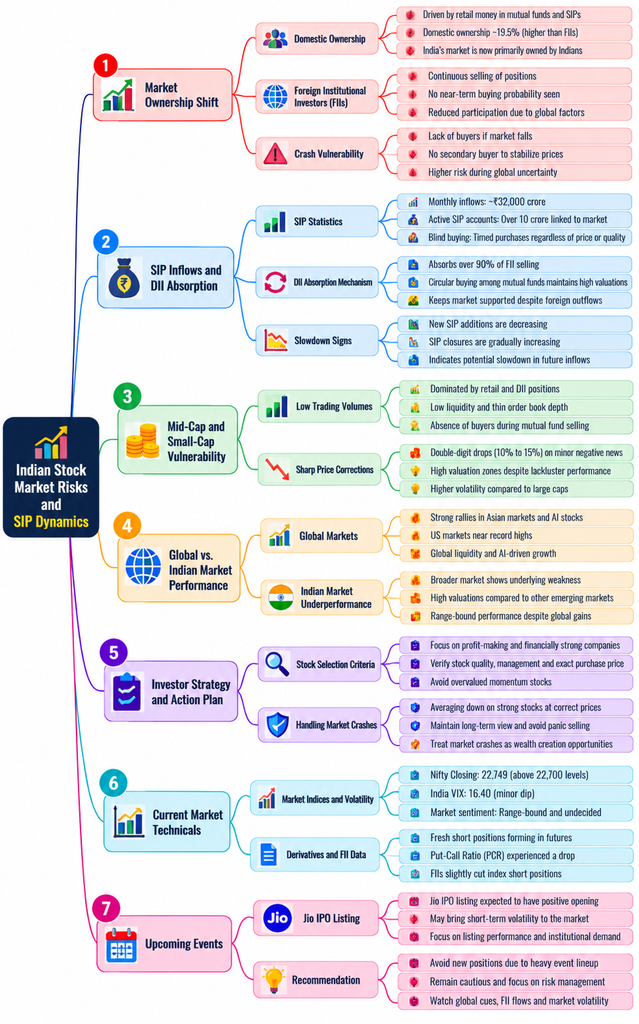
6. Conclusion: Is Your Portfolio Prepared for a Market Correction?
India’s SIP boom represents a major development in the country’s investment landscape. Regular household contributions have increased the role of domestic capital and helped domestic institutions offset periods of foreign selling.
But domestic ownership is not a guarantee against falling markets.
Record SIP inflows cannot ensure that stock valuations are reasonable. Domestic institutions cannot guarantee that every sell order will find a buyer at the previous price. Small-cap liquidity can deteriorate under stress, while changes in investor participation may affect future demand.
The latest available data also show why it is important to avoid exaggerated conclusions. September 2026 SIP contributions reached ₹32,490 crore, and the SIP stoppage ratio declined from August. Meanwhile, reported small-cap fund liquidity stress tests showed improvement compared with January 2026.
These observations do not establish that the SIP boom is ending or that an imminent market crash is inevitable.
Instead, they reinforce the need to evaluate the quality of investments rather than relying exclusively on the direction of market flows.
For long-term investors, the most useful priorities are straightforward:
- Maintain an asset allocation aligned with financial goals.
- Evaluate companies and funds using appropriate risk and valuation measures.
- Avoid excessive concentration in expensive or illiquid stocks.
- Monitor earnings, cash flows, institutional activity, and liquidity.
- Keep short-term market predictions separate from long-term investment decisions.
The real SIP trap is not investing regularly. It is assuming that regular investing automatically makes every market valuation safe.
A disciplined investor understands that SIPs are a method of investing—not a guarantee of returns, a substitute for risk management,t or protection against every market correction.
Frequently Asked Questions (FAQs)
1. Is investing through SIPs risky?
Yes. SIPs are a method of investing regularly, not a separate asset class. A SIP invested in an equity mutual fund remains exposed to market fluctuations, valuation risk,sk and the underlying fund’s portfolio risks.
2. How much money entered SIPs in September 2026?
AMFI reported SIP contributions of ₹32,490 crore in September 2026, a record monthly figure at that time.
3. Do DIIs own more Indian equities than FIIs?
According to NSE ownership data for the June 2026 quarter, DIIs held approximately 19.5% of NSE-listed companies by market capitalisation, compared with 15.1% for FPIs. These are aggregate ownership figures, not a guarantee of future buying activity.
4. Can SIP inflows prevent a stock market crash?
No. SIP inflows can contribute to investment demand, but they cannot guarantee that share prices will remain stable during a major economic or market shock.
5. Are small-cap mutual funds more risky than large-cap funds?
Small-cap funds generally have greater exposure to smaller companies, which can involve higher volatility, valuation risk and liquidity risk. The actual risk varies by fund and market conditions.
6. Should investors stop their SIPs when FIIs sell?
Not automatically. The decision depends on financial goals, investment horizon, cash-flow needs, risk tolerance and the suitability of the underlying investment. FII selling alone does not determine whether a SIP should continue.
7. What should investors check before buying an expensive stock?
Review earnings growth, valuation multiples, debt, cash generation, competitive position, corporate governance and downside risks. Compare the stock’s valuation with realistic future performance rather than relying only on market momentum.
8. Does a high India VIX guarantee that the market will fall?
No. India VIX reflects expected near-term volatility derived from Nifty options. It does not reliably predict the direction of the next market move.
Disclaimer
This article is for educational and informational purposes only. It does not constitute investment advice or a recommendation to buy or sell any security or mutual fund.
Equity investments involve market risk, including the possibility of losing capital. SIPs do not guarantee profits or protect investors against market declines. Historical data and stress-test estimates are not guarantees of future performance.
Readers should verify current figures through official AMFI, NSE, and SEBI disclosures and consult a SEBI-registered investment adviser when they need advice tailored to their financial circumstances.