
The Hidden Liquidity Risk Behind the Market’s “Resilience”
Executive Summary
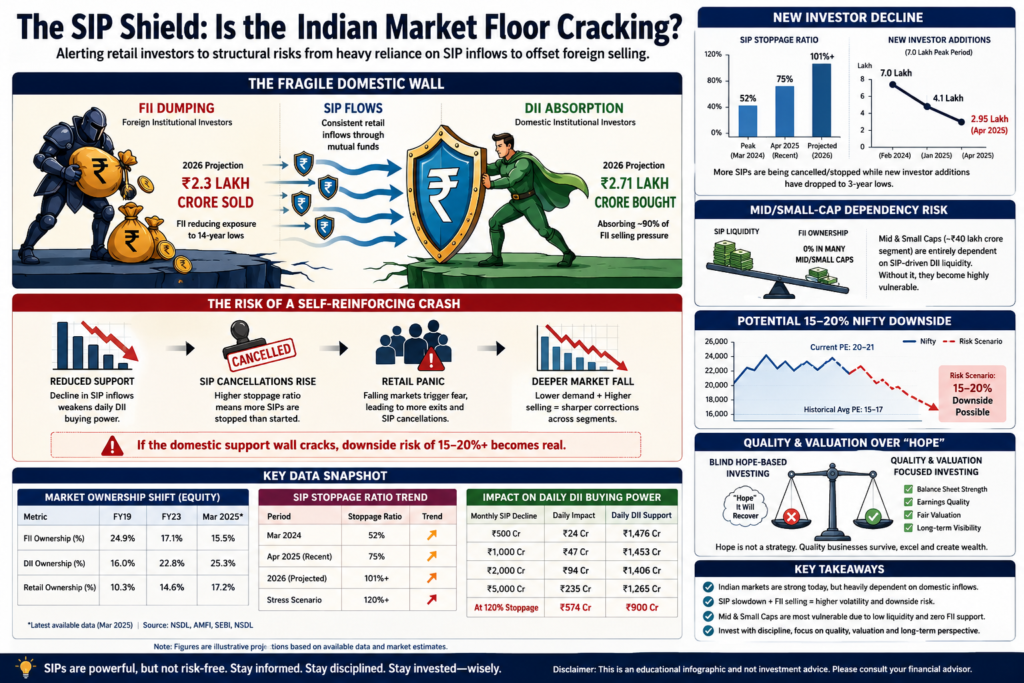
For nearly a decade, Systematic Investment Plans (SIPs) have become the backbone of India’s equity markets. Every month, millions of investors automatically deploy capital into mutual funds, creating a consistent source of liquidity.
This domestic money has successfully countered several periods of Foreign Institutional Investor (FII) selling, giving the impression that Indian markets are almost immune to global shocks.
But an important question remains:
Is the market fundamentally strong, or is it increasingly dependent on continuous SIP inflows?
If domestic inflows slow while foreign capital continues to exit, India’s current market structure could face its biggest stress test in years.
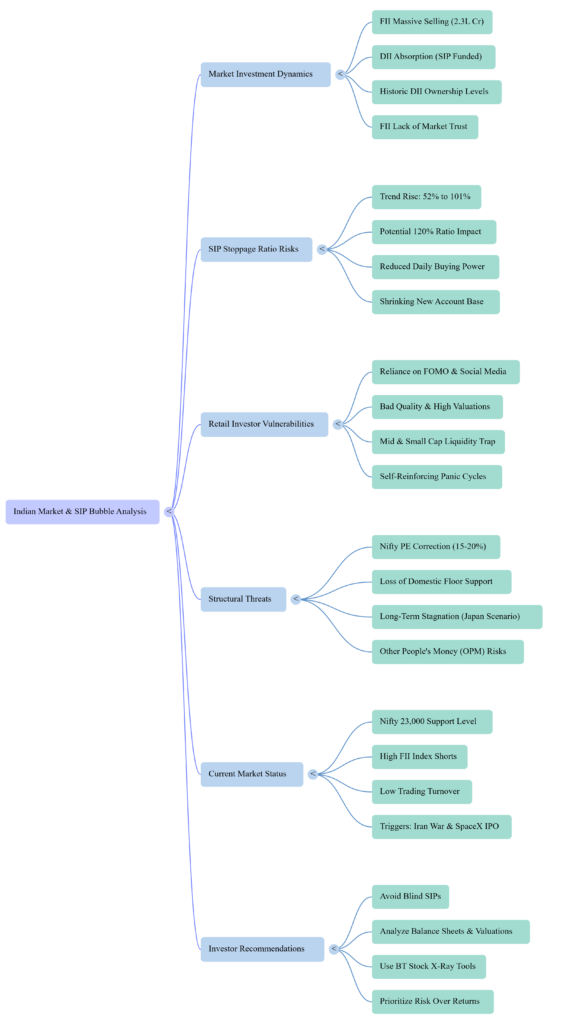
India’s Ownership Revolution
For the first time in history, Domestic Institutional Investors (DIIs) have become one of the dominant forces supporting Indian equities.
Market Ownership Shift
| Category | Previous Trend | Current Trend |
|---|---|---|
| FIIs | Largest Buyers | Net Sellers |
| DIIs | Secondary Support | Primary Buyers |
| Retail Investors | Limited Impact | Major Liquidity Source |
| SIP Flows | Moderate | Record High |
This transition demonstrates the growing financial maturity of Indian households but also increases dependence on domestic savings.
The FII vs DII Battle
Illustrative Liquidity Flow
| Participant | Estimated Action |
|---|---|
| FIIs | Selling Indian Equities |
| DIIs | Buying through Mutual Funds |
| Retail SIP Investors | Providing Fresh Capital |
| Market Stability | Dependent on Continuous Inflows |
If new inflows slow significantly, DIIs may have reduced capacity to absorb institutional selling.
Understanding the “Other People’s Money” Effect
Unlike hedge funds investing proprietary capital, mutual funds primarily invest money collected from investors.
This creates a mechanical investment process:
Monthly SIP
↓
Mutual Fund Receives Cash
↓
Fund Manager Deploys Capital
↓
Stocks Purchased
↓
Market Supported
The system functions efficiently as long as inflows remain strong.
SIP Stoppage Ratio: The Critical Indicator
One of the most important but less discussed metrics is the SIP Stoppage Ratio, which compares cancelled SIPs with newly registered SIPs.
Illustrative Trend
| Year | Stoppage Ratio |
|---|---|
| 2024 | 52% |
| 2025 (Illustrative) | 75% |
| 2026 (Scenario Model) | 101% |
| Stress Scenario | 120% |
A ratio above 100% would imply more SIP accounts closing than opening.
Impact on Daily Buying Power
Hypothetical Illustration
| Monthly SIP Decline | Daily Buying Impact |
|---|---|
| ₹500 Crore | Moderate |
| ₹1,000 Crore | Significant |
| ₹2,000 Crore | High |
| ₹5,000 Crore | Severe |
Lower inflows reduce the ability of domestic institutions to absorb market selling.
Mid & Small Cap Liquidity Risk
Many mid and small-cap companies depend heavily on domestic institutional participation.
Risk Comparison
| Large Cap | Mid Cap | Small Cap |
|---|---|---|
| High Liquidity | Medium | Low |
| Institutional Participation | High | Moderate |
| Bid-Ask Spread | Narrow | Moderate |
| Crash Risk During Panic | Low | Medium |
In low-liquidity environments, price declines can accelerate because buyers disappear.
Market Valuation Snapshot
| Indicator | Current Situation |
|---|---|
| Nifty Valuation | Above Historical Average |
| Earnings Growth Expectations | High |
| Margin of Safety | Reduced |
| Global Risks | Elevated |
Higher valuations generally leave less room for disappointment.
Historical Lessons
Markets do not always recover quickly.
Examples
| Market | Recovery Period |
|---|---|
| Japan Nikkei | Multiple Decades |
| Global Tech Bubble | Several Years |
| Indian Real Estate Stocks | Many Years |
| Quality Blue Chips | Generally Faster |
History suggests that valuation and business quality matter more than optimism.
External Risks Facing Indian Markets
| Risk Factor | Possible Impact |
|---|---|
| Rising Oil Prices | Inflation |
| Global Recession | Lower Earnings |
| FII Selling | Liquidity Pressure |
| Geopolitical Conflict | Risk-Off Sentiment |
| Large Global IPOs | Capital Reallocation |
These factors can combine to create temporary market weakness.
Scenario Analysis
Scenario 1: Bull Case
- Strong SIP growth
- Stable earnings
- FII returns
- Market continues upward
Probability: Positive if economic growth remains robust.
Scenario 2: Base Case
- Moderate SIP growth
- Mixed earnings
- Limited FII participation
- Sideways market
Most likely in a balanced macro environment.
Scenario 3: Bear Case
- SIP slowdown
- Heavy FII selling
- Global uncertainty
- Liquidity stress
Potential result:
- Large caps correct moderately
- Mid caps underperform
- Small caps experience sharp volatility
Investor Risk Matrix
| Risk | Severity |
|---|---|
| Liquidity Risk | High |
| Valuation Risk | High |
| Earnings Risk | Medium |
| Global Events | Medium |
| Retail Panic Selling | High |
Smart Investor Checklist
Before investing, ask yourself:
✅ Is the company fundamentally strong?
✅ Am I buying because of valuation or market excitement?
✅ Can I hold this investment for 10 years?
✅ Does the business generate consistent cash flows?
✅ Would I still invest if markets remained flat for several years?
Key Takeaways
- SIPs have become one of the strongest pillars supporting Indian markets.
- Domestic liquidity has helped offset periods of foreign selling.
- However, dependence on continuous inflows creates structural vulnerability if participation slows.
- Investors should avoid assuming that markets always recover quickly or that every stock benefits equally.
- Long-term wealth creation depends on disciplined investing, diversification, valuation awareness, and quality businesses—not solely on market momentum.
Final Thought
SIPs are a disciplined investment strategy, but no investment method eliminates valuation and market risks. The strongest portfolios are built on quality assets, diversification, and patience—not on the assumption that liquidity will always be abundant.