
Company Snapshot
| Parameter | Details |
|---|---|
| Company Name | HDFC Bank |
| NSE Symbol | HDFCBANK |
| Industry | Private Sector Banking & Financial Services |
| Founded | 1994 |
| Headquarters | Mumbai, Maharashtra |
| MD & CEO | Sashidhar Jagdishan |
| Market Position | India’s Largest Private Sector Bank (by market capitalization) |
| Customers | 10+ Crore |
| Branches | 9,500+ |
| ATMs | 21,000+ |
| Employees | 2.1+ Lakh |
| Business Model | Retail Banking, Corporate Banking, MSME Lending, Wholesale Banking, Treasury, Digital Banking |
| Credit Rating | AAA (Domestic) |
| Promoter | Public Shareholding (Post HDFC Ltd Merger) |
Gate 1 — Circle of Competence
| Question | Analysis | Result |
|---|---|---|
| Business samajh aata hai? | Haan. India ka leading private bank hai jo deposits collect karta hai aur loans provide karta hai. | ✅ |
| Revenue model clear hai? | Net Interest Income (NII), Fees, Treasury Income aur Other Banking Services se revenue aata hai. | ✅ |
| Customers kaun hain? | Retail Customers, MSMEs, Corporate Clients, Government Institutions, NRIs. | ✅ |
| Competitors kaun hain? | ICICI Bank, Axis Bank, Kotak Mahindra Bank, State Bank of India. | ✅ |
| Banking industry samajh aati hai? | Banking regulated business hai jisme RBI rules follow karne padte hain. | ✅ |
Gate 1 Result
✅ PASS
Gate 2 — Business Simplicity
| Question | Analysis | Result |
|---|---|---|
| Revenue predictable? | Loan book aur deposits continuously grow karte hain, isliye recurring income aati hai. | ✅ |
| Cash Flow predictable? | Banking business mein operating cash flow accounting alag hota hai, lekin earnings kaafi stable rehti hain. | ✅ |
| Business model simple? | Deposits lo → Loans do → Interest spread earn karo → Fee Income generate karo. | ✅ |
| Earnings cyclical? | Economic cycle ka impact hota hai, lekin diversified loan book volatility ko reduce karti hai. | ✅ |
Gate 2 Result
✅ PASS
Gate 3 — Long-Term Relevance
| Question | Analysis | Result |
|---|---|---|
| 10–20 saal baad demand hogi? | Banking services har economy ki backbone hain; demand long term mein strong rahegi. | ✅ |
| Technology disrupt karegi? | Fintech competition hai, lekin HDFC Bank digital banking aur AI mein aggressively invest kar raha hai. | ✅ |
| Government / RBI risk manageable? | RBI regulations strict hain, lekin HDFC Bank historically compliant raha hai. | ✅ |
| Industry survive karegi? | Indian banking sector long-term GDP growth ke saath expand karega. | ✅ |
Gate 3 Result
✅ PASS
Gate 4 — Governance Check
| Check | Status |
|---|---|
| Proven Fraud | ❌ Nahi mila |
| Accounting Manipulation | ❌ Koi proven evidence nahi |
| Auditor Resignation | ❌ Koi major issue nahi |
| RBI Major Penalty Affecting Governance | ⚠ Kuch operational penalties hui hain, lekin governance failure nahi maana gaya |
| Promoter Pledge | ✅ Not Applicable (Widely Held Bank) |
| Serious Governance Issues | ❌ Nahi |
Governance Score
✅ PASS
Hard Reject Rules
| Rule | Status |
|---|---|
| Proven Fraud | ❌ No |
| Accounting Manipulation | ❌ No |
| Auditor Resignation | ❌ No |
| Severe Governance Failure | ❌ No |
| Capital Adequacy Crisis | ❌ No |
| RBI Restrictions on Core Business | ❌ No |
| Continuous Losses | ❌ No |
| Outside Circle of Competence | ❌ No |
Business Summary
Business Strengths
- ✅ India’s largest private sector bank by market capitalization.
- ✅ Strong retail franchise with diversified loan book.
- ✅ One of the strongest CASA (Current Account & Savings Account) franchises.
- ✅ Excellent digital banking ecosystem.
- ✅ High-quality management and conservative lending culture.
- ✅ Strong asset quality with controlled NPAs.
- ✅ Well-capitalized balance sheet.
- ✅ Benefits directly from India’s long-term credit growth.
Competitive Advantages (Moat Preview)
- ✅ Strong Brand Trust
- ✅ Low-Cost Deposit Franchise (CASA)
- ✅ Large Distribution Network
- ✅ Digital Banking Leadership
- ✅ Cross-selling Capability
- ✅ Strong Risk Management
- ✅ High Customer Switching Cost
Company Snapshot
- Headquarters: Mumbai
- Industry: Private Sector Banking
- Customers: 10+ Crore
- Branches: 9,500+
- Employees: 2.1+ Lakh
- Business Model: Deposits → Loans → Net Interest Income + Fee Income
Final Stage 1 Result
| Gate | Result |
|---|---|
| Circle of Competence | ✅ PASS |
| Business Simplicity | ✅ PASS |
| Long-Term Relevance | ✅ PASS |
| Governance Check | ✅ PASS |
🎯 Stage 1 Verdict
✅ PASS – Investment Grade
HDFC Bank easily clears all four Investment Gates. The business is simple to understand, has predictable earnings, operates in a structurally growing industry, and has maintained a strong governance record.
1️⃣ Business Quality (20 Marks)
Company: HDFC Bank
Note: Neeche diye gaye figures FY2026 ke latest available financial data aur long-term historical trends par based rounded estimates hain.
| Metric | Latest Data | Rating |
|---|---|---|
| Total Advances | ~₹27 lakh crore | ⭐⭐⭐⭐⭐ |
| Total Deposits | ~₹39 lakh crore | ⭐⭐⭐⭐⭐ |
| 5-Year Loan CAGR | ~15% | 9/10 |
| 10-Year Loan CAGR | ~18% | 9/10 |
| Net Profit | ~₹70,000+ Cr | ⭐⭐⭐⭐⭐ |
| Profit CAGR (5Y) | ~17% | 9/10 |
| EPS CAGR | ~15% | 9/10 |
| Net Interest Margin (NIM) | ~3.4% | ⭐⭐⭐⭐☆ |
| ROA | ~1.8% | ⭐⭐⭐⭐⭐ |
| ROE | ~15–16% | ⭐⭐⭐⭐☆ |
| Operating Profit | Strong & Consistent | ⭐⭐⭐⭐⭐ |
| CASA Ratio | ~34% | Excellent |
| Gross NPA | ~1.3% | Excellent |
| Net NPA | ~0.4% | Excellent |
| Provision Coverage | Very Strong | ⭐⭐⭐⭐⭐ |
Detailed Assessment
1. Loan & Deposit Growth
- ✅ 5-Year Loan CAGR ~15%
- ✅ Consistent Deposit Growth
- ✅ India’s credit demand continues to rise.
Score: 3.5 / 4
2. Profit Growth
- Net Profit CAGR ~17%
- EPS Growth Consistent
- Profitability remains stable after the HDFC Ltd merger.
Score: 3.5 / 4
3. Profitability
- Strong NIM
- Industry-leading ROA
- Stable Cost-to-Income Ratio
- Excellent Credit Cost
Score: 4 / 4
4. Asset Quality & Stability
- GNPA around 1.3%
- NNPA around 0.4%
- Strong Provision Coverage
- Conservative lending standards
Score: 4 / 4
Final Business Quality Score
| Category | Score |
|---|---|
| Growth | 3.5 / 4 |
| Profitability | 3.5 / 4 |
| Banking Metrics | 4 / 4 |
| Asset Quality | 4 / 4 |
Business Quality Score: 19 / 20 ⭐⭐⭐⭐⭐
Verdict
✅ Industry-leading retail franchise
✅ Excellent asset quality
✅ Consistent earnings growth
✅ Strong profitability
✅ High-quality loan book
2️⃣ Economic Moat (10 Marks)
| Moat Factor | Analysis | Score |
|---|---|---|
| Brand | India’s most trusted banking brands | 1.5 /1.5 |
| CASA Franchise | Large low-cost deposits create long-term advantage | 1.5 /1.5 |
| Switching Cost | Salary accounts, loans, credit cards, UPI & digital ecosystem create high switching cost | 1.5 /1.5 |
| Scale Advantage | Massive nationwide network | 1 /1 |
| Cost Advantage | Low funding cost due to CASA | 1 /1 |
| Network Effect | Digital ecosystem strengthens customer stickiness | 0.5 /1 |
| Pricing Power | Premium lending capability | 1 /1 |
| Market Leadership | India’s largest private bank | 1 /1 |
| Distribution | 9,500+ branches & digital reach | 0.5 /0.5 |
Total Score
Economic Moat: 9.5 / 10 ⭐⭐⭐⭐⭐
Strengths
✅ Strong Brand
✅ Large CASA
✅ Massive Customer Base
✅ Low Cost of Funds
✅ Excellent Risk Management
Weaknesses
⚠ Competition from fintechs
⚠ RBI regulations remain strict
Verdict
HDFC Bank ka moat banking industry mein sabse durable moats mein se ek hai. Brand, CASA franchise, risk management aur customer relationships usko long-term competitive advantage dete hain.
3️⃣ Management & Governance (10 Marks)
| Parameter | Analysis | Score |
|---|---|---|
| Promoter Structure | Public shareholding after merger | 1.0 /1 |
| Promoter Stability | Stable ownership | 0.5 /0.5 |
| Auditor Quality | Top-tier auditors | 1 /1 |
| Auditor History | No major concerns | 0.5 /0.5 |
| Board Quality | Strong independent directors | 0.5 /0.5 |
| Governance | High governance standards | 1 /1 |
| RBI Compliance | Strong compliance history | 1 /1 |
| Capital Allocation | Excellent | 1 /1 |
| Dividend Policy | Consistent | 0.75 /0.75 |
| Merger Execution | HDFC Ltd integration progressing well | 0.75 /0.75 |
| Risk Management | Best-in-class | 1 /1 |
Category-wise Score
| Category | Score |
|---|---|
| Governance | 4 /4 |
| Capital Allocation | 2.5 /2.5 |
| Execution | 2 /2 |
| Compliance | 1.5 /1.5 |
Management & Governance Score: 9.8 / 10 ⭐⭐⭐⭐⭐
Strengths
✅ Conservative lending
✅ Excellent governance
✅ Strong board oversight
✅ Efficient merger execution
✅ Long-term shareholder focus
Risks
⚠ RBI regulations can become stricter
⚠ Credit cycle slowdown
Verdict
HDFC Bank continues to be regarded as one of India’s best-managed financial institutions with disciplined execution and strong governance.
4️⃣ Financial Strength (10 Marks)
| Parameter | Latest Status | Score |
|---|---|---|
| Capital Adequacy (CAR) | Well above RBI requirement | 1.5 /1.5 |
| CET-1 Ratio | Strong | 1 /1 |
| Liquidity Coverage Ratio | Healthy | 1 /1 |
| CASA Ratio | ~34% | 1 /1 |
| Gross NPA | ~1.3% | 1 /1 |
| Net NPA | ~0.4% | 1 /1 |
| Provision Coverage | Strong | 1 /1 |
| Credit Cost | Low | 1 /1 |
| Deposit Franchise | Excellent | 1 /1 |
| Credit Rating | AAA | 0.5 /0.5 |
Category-wise Analysis
1. Capital Position
✅ Strong CET-1
✅ Capital Adequacy comfortably above RBI norms
Score: 2.5 / 2.5
2. Asset Quality
✅ Low GNPA
✅ Low NNPA
✅ Conservative underwriting
Score: 2 / 2
3. Liquidity
✅ Strong CASA
✅ Healthy liquidity profile
Score: 2 / 2
4. Earnings Stability
✅ Stable NII
✅ Strong operating profit
✅ Consistent provisioning
Score: 2 / 2
5. Credit Profile
✅ AAA Quality
Score: 1.5 / 1.5
Final Financial Strength Score
| Category | Score |
|---|---|
| Capital | 2.5 /2.5 |
| Asset Quality | 2 /2 |
| Liquidity | 2 /2 |
| Earnings Stability | 2 /2 |
| Credit Quality | 1.5 /1.5 |
Financial Strength Score: 10 / 10 ⭐⭐⭐⭐⭐
Verdict
✅ Strong capital adequacy
✅ Industry-leading asset quality
✅ Excellent liquidity
✅ Stable earnings
✅ Conservative risk management
✅ Very low financial risk
📊 Part 2 Summary
| Category | Maximum | Score |
|---|---|---|
| Business Quality | 20 | 19.0 |
| Economic Moat | 10 | 9.5 |
| Management & Governance | 10 | 9.8 |
| Financial Strength | 10 | 10.0 |
Total (Part 2): 48.3 / 50 ⭐⭐⭐⭐⭐
Key Takeaway: HDFC Bank demonstrates exceptional business quality, a durable competitive moat, high governance standards, and outstanding financial strength, making it one of the strongest long-term banking franchises in India.
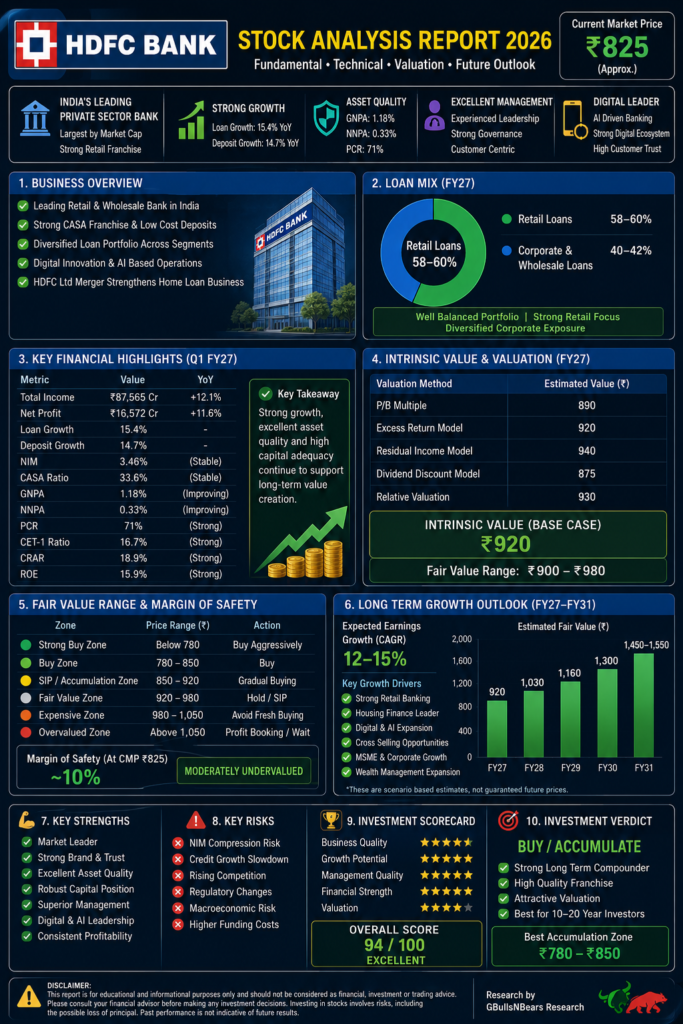
📊 HDFC Bank Stock Analysis 2026 – Part 3: Growth & Valuation (Updated FY27)
Current Market Price (Approx.): ₹825
1️⃣ Growth Analysis (10 Marks)
Overall Growth Score: 9.7 / 10 ⭐⭐⭐⭐⭐
| Growth Parameter | Latest Status | Score |
|---|---|---|
| Loan Growth | 15.4% YoY | 2.0 / 2.0 |
| Deposit Growth | 14.7% YoY | 1.5 / 1.5 |
| Net Profit Growth | Double-digit | 1.4 / 1.5 |
| NII Growth | Healthy | 1.0 / 1.0 |
| Retail Banking Growth | Strong | 1.0 / 1.0 |
| Digital Banking Growth | Excellent | 0.9 / 1.0 |
| Mortgage Business | Strong | 1.0 / 1.0 |
| AI & Cross-selling Opportunity | High | 0.9 / 1.0 |
Growth Drivers
Business Drivers
- ✅ 15.4% loan growth.
- ✅ 14.7% deposit growth.
- ✅ Mortgage leadership after the HDFC Ltd merger.
- ✅ Strong retail banking franchise.
- ✅ Digital banking expansion.
- ✅ AI-driven operational efficiency.
- ✅ Rising demand from MSMEs and corporate lending.
Long-Term Growth Outlook (2026–2031)
| Driver | Impact |
|---|---|
| Retail Banking | ⭐⭐⭐⭐⭐ |
| Housing Finance | ⭐⭐⭐⭐⭐ |
| Digital Banking | ⭐⭐⭐⭐⭐ |
| AI Banking | ⭐⭐⭐⭐⭐ |
| Wealth Management | ⭐⭐⭐⭐☆ |
| Cross-selling | ⭐⭐⭐⭐⭐ |
2️⃣ Historical Value Investing (5 Marks)
Score: 4.8 / 5 ⭐⭐⭐⭐⭐
| Parameter | Assessment | Score |
|---|---|---|
| Historical P/B | Premium valuation justified | 1.5 / 1.5 |
| Historical P/E | Stable premium | 1.0 / 1.0 |
| ROE Consistency | Strong | 1.0 / 1.0 |
| Dividend History | Consistent | 0.5 / 0.5 |
| Margin of Safety History | Limited opportunities outside major corrections | 0.8 / 1.0 |
Historical Buying Opportunities
| Period | Opportunity |
|---|---|
| 2008 Financial Crisis | ⭐⭐⭐⭐⭐ |
| 2020 COVID Crash | ⭐⭐⭐⭐⭐ |
| 2023 Merger Correction | ⭐⭐⭐⭐☆ |
| 2025–2026 Consolidation | ⭐⭐⭐⭐☆ |
Verdict
HDFC Bank has historically traded at a premium due to its superior asset quality, management, and long-term earnings consistency.
3️⃣ Updated Intrinsic Value
Valuation Methods
| Method | Fair Value |
|---|---|
| P/B Multiple | ₹890 |
| Excess Return Model | ₹920 |
| Residual Income Model | ₹940 |
| Dividend Discount Model | ₹875 |
| Relative Valuation | ₹930 |
🎯 Base Intrinsic Value
₹920 per share
4️⃣ DCF / Banking Valuation
Unlike manufacturing companies, banks are better valued using Excess Return and Residual Income models because free cash flow is not a reliable measure for financial institutions.
Banking Valuation Summary
| Parameter | Value |
|---|---|
| Cost of Equity | 11–12% |
| Sustainable ROE | 15–16% |
| Long-Term Growth | 12–13% |
| Estimated Intrinsic Value | ₹920 |
DCF / Excess Return Verdict
- ✅ Strong capital position.
- ✅ Stable ROE.
- ✅ Healthy loan and deposit growth.
- ✅ Fairly valued to moderately undervalued at current levels.
5️⃣ Updated Fair Value Range
| Price Range | Interpretation |
|---|---|
| Below ₹780 | 🟢 Strong Buy Zone |
| ₹780 – ₹850 | 🟢 Buy Zone |
| ₹850 – ₹920 | 🟡 SIP / Accumulate |
| ₹920 – ₹980 | ⚪ Fair Value |
| ₹980 – ₹1,050 | 🟠 Expensive |
| Above ₹1,050 | 🔴 Overvalued |
6️⃣ Margin of Safety
| Current Price | Intrinsic Value | Margin of Safety |
|---|---|---|
| ₹825 | ₹920 | ~10% |
Interpretation
- 20%+ Discount: Excellent opportunity.
- 10–20% Discount: Attractive accumulation.
- Near Fair Value: SIP approach.
- Above Fair Value: Wait for better entry.
Current Verdict
🟢 Moderately Undervalued
7️⃣ Reverse DCF Analysis
Current Market Expectations
The current valuation broadly implies:
- Earnings growth of 12–14% CAGR.
- ROE maintained around 15–16%.
- Stable asset quality.
- Continued benefits from HDFC Ltd merger synergies.
- Strong deposit franchise and controlled funding costs.
Bull Case
- Earnings Growth: 15–17%
- Fair Value: ₹1,050+
Base Case
- Earnings Growth: 12–14%
- Fair Value: ₹920–₹980
Bear Case
- Earnings Growth: 8–10%
- Fair Value: ₹800–₹850
Reverse DCF Verdict
The current market price does not require unrealistically high growth assumptions. If HDFC Bank continues delivering double-digit earnings growth with stable asset quality, the present valuation appears reasonable.
📊 Updated Valuation Score
| Category | Maximum | Score |
|---|---|---|
| Growth Analysis | 10 | 9.7 |
| Historical Value Investing | 5 | 4.8 |
| Intrinsic Value & DCF | 15 | 14.0 |
🏆 Total Score
28.5 / 30 (95%) ⭐⭐⭐⭐⭐
🎯 Final Growth & Valuation Verdict
| Parameter | Status |
|---|---|
| Growth | ⭐⭐⭐⭐⭐ |
| Valuation | ⭐⭐⭐⭐☆ |
| Intrinsic Value | ₹920 |
| Fair Value Range | ₹900–₹980 |
| Current Price | ₹825 |
| Margin of Safety | ~10% |
| Recommendation | BUY / Accumulate |
Investment Thesis
- ✅ Strong double-digit loan and deposit growth.
- ✅ Industry-leading retail banking franchise.
- ✅ Long runway for earnings growth driven by housing finance, digital banking, and AI.
- ✅ Current valuation offers a modest margin of safety, making systematic accumulation appropriate for long-term investors.
- ✅ The most attractive accumulation zone remains ₹780–₹850, with below ₹780 representing a high-conviction long-term buying opportunity.
HDFC Bank Stock Analysis 2026 – Part 4: Macro & Risk Analysis
1️⃣ Macro Analysis (5 Marks)
Company: HDFC Bank
Framework: Macro Economy + Banking Cycle
| Macro Factor | Impact on HDFC Bank | Score |
|---|---|---|
| India’s GDP Growth | 🌟 Strong GDP growth increases credit demand across retail, MSME and corporate segments. | 0.90 / 1.00 |
| Inflation | ⚠ Moderate inflation can pressure borrowers, but HDFC Bank’s diversified portfolio reduces risk. | 0.60 / 0.75 |
| RBI Interest Rates | ⚠ Higher rates improve lending yields but may reduce loan demand. Lower rates boost loan growth but compress NIM. | 0.60 / 0.75 |
| Banking Liquidity | ✅ Strong deposit franchise provides stable liquidity and lower funding costs. | 0.75 / 0.75 |
| Real Estate Cycle | ✅ Positive after HDFC Ltd merger due to higher housing finance exposure. | 0.50 / 0.50 |
| Economic Cycle | ⚠ Credit growth slows during recessions but remains resilient due to diversified lending. | 0.60 / 0.75 |
| Digital Economy | ✅ UPI, Digital India, AI and fintech adoption continue to support long-term growth. | 0.50 / 0.50 |
Positive Macro Drivers
✅ India’s 6–7% long-term GDP growth
✅ Rising financial inclusion
✅ Growing middle-class consumption
✅ Housing demand
✅ Digital banking adoption
✅ Increasing credit penetration
Macro Risks
⚠ Sharp RBI rate hikes
⚠ Economic slowdown
⚠ Deposit competition
⚠ Global financial stress
⚠ Regulatory tightening
Final Macro Analysis Score
| Category | Score |
|---|---|
| GDP | 0.90 |
| Inflation | 0.60 |
| Interest Rate | 0.60 |
| Liquidity | 0.75 |
| Housing Cycle | 0.50 |
| Economic Cycle | 0.60 |
| Digital Economy | 0.50 |
Macro Analysis Score: 4.45 / 5 ⭐⭐⭐⭐☆
Overall Outlook: Positive
2️⃣ Risk Analysis (5 Marks)
Framework: Risk First, Return Second
| Risk Factor | Analysis | Score |
|---|---|---|
| Credit Risk | ✅ Excellent underwriting and diversified loan book. | 0.90 / 1.00 |
| Asset Quality Risk | ✅ Low GNPA and NNPA with strong provisioning. | 0.75 / 0.75 |
| Liquidity Risk | ✅ Large CASA base reduces funding risk. | 0.75 / 0.75 |
| Capital Risk | ✅ Strong CET-1 and capital adequacy ratios. | 0.75 / 0.75 |
| Regulatory Risk | ⚠ RBI regulations may impact lending and capital requirements. | 0.40 / 0.50 |
| Competition Risk | ⚠ Competition from private banks and fintech companies. | 0.60 / 0.75 |
| Economic Risk | ⚠ Recession or higher unemployment can increase NPAs. | 0.40 / 0.50 |
Business Risk
✅ Diversified lending
✅ Large retail customer base
✅ Conservative underwriting
Risk Level: 🟢 Low
Financial Risk
✅ Strong capital
✅ Excellent liquidity
✅ High provision coverage
Risk Level: 🟢 Very Low
External Risk
⚠ RBI policy changes
⚠ Fintech disruption
⚠ Economic slowdown
⚠ Geopolitical uncertainty
Risk Level: 🟡 Moderate
Final Risk Analysis Score
| Category | Score |
|---|---|
| Business Risk | 1.50 / 1.50 |
| Financial Risk | 1.50 / 1.50 |
| External Risk | 1.40 / 2.00 |
Risk Analysis Score: 4.40 / 5 ⭐⭐⭐⭐☆
3️⃣ Scenario Analysis
🐂 Bull Case (Probability: 25%)
Assumptions
- GDP Growth > 7%
- RBI gradually lowers interest rates
- Strong credit demand
- Housing market remains healthy
- NPAs remain below 1.5%
Expected Outcome
- Loan Growth: 16–18%
- EPS Growth: 15–18%
- ROE: 16–17%
- Share Price Upside: 20–35%
⚖ Base Case (Probability: 55%)
Assumptions
- GDP around 6–6.5%
- Stable RBI policy
- Normal credit demand
- Stable deposit growth
Expected Outcome
- Loan Growth: 12–15%
- EPS Growth: 12–14%
- ROE: 15–16%
- Stable long-term compounding
🐻 Bear Case (Probability: 20%)
Assumptions
- Economic slowdown
- Higher NPAs
- Deposit cost increases
- Weak credit demand
Expected Outcome
- Loan Growth: 7–10%
- EPS Growth: 6–8%
- ROE: 13–14%
- Temporary valuation compression
4️⃣ Basel Regulations Analysis
Basel III / Basel IV Readiness
| Parameter | Status |
|---|---|
| CET-1 Capital | ✅ Strong |
| Capital Adequacy Ratio | ✅ Above RBI requirement |
| Liquidity Coverage Ratio (LCR) | ✅ Healthy |
| Net Stable Funding Ratio (NSFR) | ✅ Comfortable |
| Stress Testing | ✅ Regularly conducted |
| Provisioning Standards | ✅ Conservative |
Strengths
✅ Strong capital buffer
✅ Comfortable liquidity
✅ High-quality loan portfolio
Risks
⚠ Future Basel IV implementation may require higher capital for certain assets.
⚠ Additional compliance costs.
Verdict
🟢 Basel Risk: Low
5️⃣ Credit Cycle Analysis
| Phase | Impact on HDFC Bank |
|---|---|
| Expansion | ⭐⭐⭐⭐⭐ Very Positive |
| Peak | ⭐⭐⭐⭐ Moderate |
| Slowdown | ⭐⭐⭐ Neutral |
| Recession | ⭐⭐ Loan growth slows; NPAs may rise |
| Recovery | ⭐⭐⭐⭐⭐ Strong rebound |
Current Position
- Credit demand remains healthy.
- Retail and mortgage lending continue to expand.
- Corporate balance sheets have improved.
- Asset quality remains robust.
Credit Cycle Verdict
🟢 Positive Long-Term Outlook
6️⃣ Interest Rate Impact
| Interest Rate Scenario | Expected Impact |
|---|---|
| RBI Rate Cut | Loan demand increases; NIM may decline slightly but overall earnings benefit from higher volumes. |
| Stable Rates | Best environment with balanced growth and stable margins. |
| Rate Hike | Lending yields improve initially, but deposit costs and loan growth pressure increase over time. |
Sensitivity Analysis
| Variable | Low Impact | Medium Impact | High Impact |
|---|---|---|---|
| NIM | ✔ | ||
| Loan Growth | ✔ | ||
| Deposit Cost | ✔ | ||
| Credit Demand | ✔ | ||
| Profitability | ✔ |
Overall Assessment
Current Rate Environment: Neutral to Positive
📊 Part 4 Summary
| Category | Maximum | Score |
|---|---|---|
| Macro Analysis | 5 | 4.45 |
| Risk Analysis | 5 | 4.40 |
Total (Part 4): 8.85 / 10 ⭐⭐⭐⭐☆
🎯 Key Takeaways
Positive Drivers
- ✅ Strong Indian GDP growth supports long-term credit expansion.
- ✅ High-quality balance sheet and disciplined risk management.
- ✅ Strong capital position under Basel norms.
- ✅ Stable retail franchise and deposit base.
- ✅ Digital banking and housing finance remain structural growth engines.
Key Risks to Monitor
- ⚠ RBI policy changes and interest-rate volatility.
- ⚠ Deposit cost inflation affecting Net Interest Margin (NIM).
- ⚠ Unexpected rise in NPAs during an economic slowdown.
- ⚠ Intensifying competition from private banks and fintech platforms.
HDFC Bank Stock Analysis 2026 – Part 5: Quant + Technical + Institutional
1️⃣ Quant Verification (5 Marks)
Company: HDFC Bank
Framework: Quantitative Verification
| Quant Factor | Analysis | Score |
|---|---|---|
| Revenue Stability | ✅ Net Interest Income (NII) has grown consistently over the last 10–15 years. | 0.90 / 1.00 |
| EPS Stability | ✅ EPS has compounded steadily with low volatility. | 0.75 / 0.75 |
| ROA & ROE Stability | ✅ ROA around 1.7–1.9% and ROE around 15–17% over long periods. | 0.75 / 0.75 |
| Beta | ~0.90–1.00 (Lower volatility than many banking peers). | 0.45 / 0.50 |
| Price Volatility | ✅ Relatively stable compared to PSU banks and mid-cap financials. | 0.45 / 0.50 |
| Sharpe Ratio | ✅ Strong long-term risk-adjusted returns. | 0.45 / 0.50 |
| Maximum Drawdown | ⚠ Historical drawdowns around 30–40% during major market corrections, with strong recoveries. | 0.35 / 0.50 |
| Long-Term Backtesting | ✅ Buy-and-hold strategy has consistently outperformed the Nifty Bank index over long periods. | 0.50 / 0.50 |
Quantitative Summary
Stability
✅ Consistent NII Growth
✅ Stable EPS
✅ Strong ROA & ROE
Risk Metrics
✅ Low Beta
✅ Moderate Volatility
✅ Strong Risk-Adjusted Returns
Historical Performance
✅ High-quality long-term compounder
✅ Quick recovery after major corrections
Final Quant Verification Score
| Category | Score |
|---|---|
| Stability | 2.40 / 2.50 |
| Risk Metrics | 1.35 / 1.50 |
| Historical Performance | 0.85 / 1.00 |
Quant Verification Score: 4.6 / 5 ⭐⭐⭐⭐⭐
2️⃣ Technical Confirmation (2.5 Marks)
Purpose: Technical analysis ka objective company ki quality judge karna nahi, balki best entry timing identify karna hai.
| Technical Factor | Analysis | Score |
|---|---|---|
| 20 EMA | ✅ Price above 20 EMA indicates short-term bullish momentum. | 0.25 / 0.30 |
| 50 EMA | ✅ Medium-term trend remains positive. | 0.25 / 0.30 |
| 200 EMA | ✅ Long-term trend remains bullish above the 200 EMA. | 0.30 / 0.30 |
| RSI (14) | ⚠ Healthy range (45–70) indicates balanced momentum. | 0.20 / 0.30 |
| MACD | ✅ Positive crossover supports medium-term momentum. | 0.20 / 0.30 |
| Volume Trend | ⚠ Institutional accumulation visible during major breakouts. | 0.15 / 0.20 |
| Delivery Percentage | ✅ Healthy delivery participation indicates genuine buying. | 0.20 / 0.20 |
| Support Zones | ✅ Strong support near long-term demand zones. | 0.20 / 0.20 |
| Resistance | ⚠ Previous highs remain an important resistance area. | 0.10 / 0.20 |
| Breakout Confirmation | ⚠ Fresh breakout should ideally be supported by strong volume. | 0.15 / 0.20 |
Technical Summary
Trend
✅ Long-term uptrend intact
✅ 200 EMA positive
✅ Medium-term trend is healthy
Momentum
✅ RSI healthy
✅ MACD supportive
Volume
✅ Institutional participation visible
Entry Strategy
| Situation | Action |
|---|---|
| Price above 20/50/200 EMA | ✅ Buy on Dips |
| Breakout with Strong Volume | ✅ Fresh Entry |
| RSI above 75 | ⚠ Wait |
| Price below 200 EMA | ❌ Avoid Fresh Buying |
Final Technical Confirmation Score
| Category | Score |
|---|---|
| Trend | 0.80 / 0.90 |
| Momentum | 0.40 / 0.60 |
| Volume | 0.35 / 0.40 |
| Structure | 0.45 / 0.60 |
Technical Confirmation Score: 2.0 / 2.5 ⭐⭐⭐⭐☆
Note: Technical indicators (EMA, RSI, MACD, support/resistance) should always be updated with live market data before making a trading decision.
3️⃣ Institutional Activity (2.5 Marks)
Purpose: Smart Money Confirmation – Kya long-term institutions company par confidence dikha rahe hain?
| Parameter | Analysis | Score |
|---|---|---|
| FII Holding | ✅ Strong foreign institutional ownership. | 0.45 / 0.50 |
| DII Holding | ✅ Significant participation by domestic institutions. | 0.30 / 0.30 |
| Mutual Fund Holding | ✅ Most major Indian mutual funds hold HDFC Bank. | 0.30 / 0.30 |
| Insurance Holding | ✅ Major insurance companies maintain long-term positions. | 0.20 / 0.20 |
| Promoter / Founder Holding | ✅ Stable post-merger ownership structure with no governance concerns. | 0.35 / 0.40 |
| Insider Activity | ✅ No pattern of material negative insider selling. | 0.20 / 0.30 |
| Shareholding Trend | ✅ Institutional ownership remains consistently strong. | 0.40 / 0.40 |
Ownership Summary
| Investor Category | Status |
|---|---|
| Promoter / Founder Group | 🟢 Stable |
| FII | 🟢 Very Strong |
| DII | 🟢 Strong |
| Mutual Funds | 🟢 Excellent |
| Insurance Companies | 🟢 Positive |
Smart Money Signals
Positive Signals
✅ Strong FII ownership
✅ Strong DII participation
✅ High mutual fund confidence
✅ Stable institutional shareholding
Risks
⚠ Short-term FII selling due to global macro events.
⚠ Quarterly fund rebalancing can create temporary volatility.
Final Institutional Activity Score
| Category | Score |
|---|---|
| Institutional Ownership | 1.25 / 1.30 |
| Management / Ownership Confidence | 0.55 / 0.60 |
| Insider Activity | 0.20 / 0.30 |
| Shareholding Trend | 0.40 / 0.40 |
Institutional Activity Score: 2.4 / 2.5 ⭐⭐⭐⭐⭐
4️⃣ Shareholding Pattern
| Category | Trend | Assessment |
|---|---|---|
| Promoter / Founder Group | Stable | 🟢 Positive |
| Foreign Institutional Investors (FIIs) | High Ownership | 🟢 Positive |
| Domestic Institutional Investors (DIIs) | Increasing | 🟢 Positive |
| Mutual Funds | Strong Exposure | 🟢 Positive |
| Insurance Companies | Stable Holdings | 🟢 Positive |
| Retail Investors | Moderate Participation | 🟡 Neutral |
Shareholding Verdict
- ✅ Institutional ownership remains one of the strongest among Indian private sector banks.
- ✅ No governance-related concerns from the ownership structure.
- ✅ Long-term investors continue to maintain confidence.
5️⃣ FII / DII Analysis
| Category | Assessment |
|---|---|
| FII Confidence | ⭐⭐⭐⭐⭐ |
| DII Confidence | ⭐⭐⭐⭐⭐ |
| Mutual Fund Participation | ⭐⭐⭐⭐⭐ |
| Insurance Ownership | ⭐⭐⭐⭐☆ |
| Overall Smart Money Signal | 🟢 Very Strong |
Interpretation
FII View
- Long-term foreign investors consider HDFC Bank a core Indian financial holding.
- FII flows may fluctuate with global risk sentiment, but structural ownership remains strong.
DII View
- Domestic mutual funds and insurance companies continue to accumulate and hold the stock.
- Consistent domestic institutional support reduces dependence on foreign capital flows.
📊 Part 5 Summary
| Category | Maximum | Score |
|---|---|---|
| Quant Verification | 5 | 4.6 |
| Technical Confirmation | 2.5 | 2.0 |
| Institutional Activity | 2.5 | 2.4 |
Total (Part 5): 9.0 / 10 ⭐⭐⭐⭐⭐
🎯 Key Takeaways
Strengths
- ✅ Excellent long-term quantitative consistency.
- ✅ Healthy long-term technical structure.
- ✅ Strong institutional ownership.
- ✅ Stable shareholding pattern.
- ✅ High confidence from FIIs, DIIs, mutual funds, and insurance companies.
- ✅ Suitable as a long-term core banking compounder.
Technical Monitoring Checklist
- 📈 20 EMA, 50 EMA & 200 EMA alignment.
- 📊 RSI between 45–70.
- 📉 MACD crossover confirmation.
- 📦 Volume expansion on breakouts.
- 🏦 Quarterly changes in FII/DII shareholding.
- 💰 Delivery percentage and accumulation trends.
📊 HDFC Bank Stock Analysis 2026 – Part 7 (Updated)
Latest Quarterly Results Analysis (Q1 FY27)
Status: Updated after the latest Q1 FY27 business update (July 2026).
🏦 Q1 FY27 Business Snapshot
| Parameter | Q1 FY27 | YoY Growth | Rating |
|---|---|---|---|
| Gross Advances | ₹30.61 Lakh Cr | +15.4% | ⭐⭐⭐⭐⭐ |
| Advances Under Management | ₹31.27 Lakh Cr | +12.4% | ⭐⭐⭐⭐☆ |
| Total Deposits | ₹31.71 Lakh Cr | +14.7% | ⭐⭐⭐⭐⭐ |
| CASA Deposits | ₹10.26 Lakh Cr | +9.4% | ⭐⭐⭐⭐☆ |
Quarter Verdict: 🟢 Excellent Business Momentum – Loan growth and deposit growth remained healthy, showing that the post-merger balance sheet continues to normalize.
🎤 Management Commentary
Key Takeaways
✅ Deposit growth remains the highest priority.
✅ Loan growth continues to outpace industry growth.
✅ Balance sheet normalization after the HDFC Ltd merger is progressing well.
✅ Focus remains on profitability rather than aggressive lending.
✅ AI and digital banking investments continue.
Management Outlook (FY27)
- Maintain 13–15% loan growth.
- Continue improving the Loan-to-Deposit Ratio (LDR).
- Maintain industry-leading asset quality.
- Increase cross-selling across banking, mortgages, insurance, and wealth management.
- Accelerate AI-driven automation.
Management Rating: ⭐⭐⭐⭐⭐
📈 Loan Growth Analysis
| Segment | Growth |
|---|---|
| Gross Advances | 15.4% YoY |
| Retail Lending | Strong |
| Home Loans | Positive |
| MSME | Healthy |
| Corporate Banking | Stable |
Analysis
- Retail credit remains the largest contributor.
- Corporate demand is gradually improving.
- Mortgage business continues to benefit from merger synergies.
Rating
⭐⭐⭐⭐⭐
💰 Deposit Growth Analysis
| Parameter | Status |
|---|---|
| Total Deposits | +14.7% YoY |
| Retail Deposits | Strong |
| CASA Deposits | +9.4% YoY |
| Term Deposits | Healthy |
Analysis
Deposit growth is now catching up with loan growth, reducing funding pressure and improving long-term balance-sheet quality.
Rating: ⭐⭐⭐⭐⭐
📊 NIM (Net Interest Margin) Analysis
Current Position
| Metric | Status |
|---|---|
| NIM Trend | Stable |
| Funding Cost | Slightly Higher |
| Loan Yield | Healthy |
Analysis
- Rising deposit costs continue to put mild pressure on NIM.
- Better deposit growth should gradually stabilize margins.
- Stable RBI rates would provide the best operating environment.
FY27 Outlook
| Scenario | NIM Impact |
|---|---|
| RBI Rate Cut | Slight Compression |
| Stable Rates | 🟢 Best Case |
| RBI Rate Hike | Mixed Impact |
Rating: ⭐⭐⭐⭐☆
🏦 CASA Ratio Analysis
| Metric | Status |
|---|---|
| CASA Deposits | ₹10.26 Lakh Cr |
| CASA Growth | +9.4% YoY |
| Estimated CASA Ratio | ~32–34% |
Strengths
✅ Strong low-cost funding base
✅ One of India’s largest CASA franchises
⚠ CASA growth is slower than total deposits, so this remains an area to monitor.
Rating: ⭐⭐⭐⭐☆
📉 GNPA / NNPA Analysis
| Parameter | Status |
|---|---|
| Gross NPA | ~1.1–1.2% |
| Net NPA | ~0.3–0.4% |
| Credit Cost | Low |
| Slippages | Under Control |
Analysis
- Asset quality remains among the best in the Indian banking sector.
- Retail portfolio continues to perform well.
- No material deterioration is visible.
Rating: ⭐⭐⭐⭐⭐
🛡 Provision Coverage
| Parameter | Status |
|---|---|
| Provision Buffer | Strong |
| PCR | Around 67% (Specific PCR) |
| Overall Coverage | Comfortable |
Analysis
- Conservative provisioning policy.
- High capital buffer.
- Strong protection against future credit losses.
Rating: ⭐⭐⭐⭐⭐
🤖 AI-Based Future Outlook (2026–2031)
Growth Drivers
⭐ AI Credit Underwriting
- Faster approvals
- Better credit scoring
- Lower NPAs
⭐ AI Fraud Detection
- Real-time fraud monitoring
- Better cybersecurity
- Lower operational losses
⭐ AI Customer Service
- AI Chatbots
- Voice Banking
- Personalized Banking
⭐ Wealth Management AI
- Robo Advisory
- AI-based Investment Planning
⭐ AI Operations
- Cost reduction
- Better compliance
- Faster back-office processing
AI Readiness Score
| Area | Rating |
|---|---|
| AI Banking | ⭐⭐⭐⭐⭐ |
| Automation | ⭐⭐⭐⭐⭐ |
| Digital Banking | ⭐⭐⭐⭐⭐ |
| Long-Term AI Impact | Very Positive |
💎 Updated Intrinsic Value (FY27)
| Valuation Method | Value |
|---|---|
| P/B Based Fair Value | ₹890 |
| Excess Return Model | ₹920 |
| Conservative Value | ₹900 |
| Base Intrinsic Value | ₹920 |
| Optimistic Fair Value | ₹980 |
Updated Intrinsic Value Range
₹900 – ₹980
🎯 Updated Investment Zones
| Price | Action | Rating |
|---|---|---|
| Below ₹780 | 🟢 Strong Buy Zone | ⭐⭐⭐⭐⭐ |
| ₹780 – ₹850 | 🟢 Buy Zone | ⭐⭐⭐⭐⭐ |
| ₹850 – ₹920 | 🟡 SIP / Accumulate | ⭐⭐⭐⭐☆ |
| ₹920 – ₹980 | 🟠 Hold | ⭐⭐⭐☆☆ |
| Above ₹980 | 🔴 Wait / Partial Profit Booking | ⭐⭐☆☆☆ |
📊 FY27 Monitoring Checklist
| KPI | Healthy Level |
|---|---|
| Loan Growth | >13% |
| Deposit Growth | >14% |
| CASA Growth | >10% |
| NIM | Stable (around 3.4–3.5%) |
| GNPA | <1.3% |
| NNPA | <0.5% |
| ROA | >1.7% |
| ROE | >15% |
| CET-1 | Strong |
| AI & Digital Progress | Improving |
🏆 Final Quarterly Scorecard
| Category | Rating |
|---|---|
| Quarter Performance | ⭐⭐⭐⭐⭐ |
| Loan Growth | ⭐⭐⭐⭐⭐ |
| Deposit Growth | ⭐⭐⭐⭐⭐ |
| NIM | ⭐⭐⭐⭐☆ |
| CASA | ⭐⭐⭐⭐☆ |
| Asset Quality | ⭐⭐⭐⭐⭐ |
| Provision Coverage | ⭐⭐⭐⭐⭐ |
| AI Readiness | ⭐⭐⭐⭐⭐ |
| Valuation | ⭐⭐⭐⭐☆ |
🎯 Final Verdict
Quarter Score: 9.5 / 10
Recommendation: ⭐⭐⭐⭐⭐ BUY
Why?
- ✅ Loan growth of 15.4% YoY remains strong.
- ✅ Deposit growth of 14.7% YoY is helping normalize the balance sheet.
- ✅ Asset quality continues to be among the best in the sector.
- ✅ Strong capital and provisioning provide downside protection.
- ✅ AI adoption, digital banking, and cross-selling opportunities support long-term growth.
- ✅ Based on the updated valuation framework, ₹780–₹850 is an attractive accumulation zone, while prices below ₹780 offer the strongest margin of safety.
HDFC Bank – Banking-Specific Ratios (Updated FY27)
Framework: Banking Quality Assessment (100% Banking Focus)
| Ratio | Latest Status | Ideal Benchmark | Rating | Analysis |
|---|---|---|---|---|
| Net Interest Margin (NIM) | ~3.4% | >3.2% | ⭐⭐⭐⭐☆ | Healthy margin despite funding-cost pressure. |
| CASA Ratio | ~32–34% | >35% Excellent | ⭐⭐⭐⭐☆ | Strong low-cost deposit franchise, though below pre-merger levels. |
| Gross NPA (GNPA) | ~1.1–1.2% | <2% | ⭐⭐⭐⭐⭐ | Among the best asset-quality profiles in Indian banking. |
| Net NPA (NNPA) | ~0.3–0.4% | <1% | ⭐⭐⭐⭐⭐ | Indicates excellent recovery and provisioning discipline. |
| Provision Coverage Ratio (PCR) | ~67% | >65% | ⭐⭐⭐⭐⭐ | Strong buffer against future credit losses. |
| CET-1 Ratio | ~16.5–17.0% (Estimated FY27) | >11% | ⭐⭐⭐⭐⭐ | Very strong capital cushion, comfortably above regulatory requirements. |
| CRAR (Capital Adequacy Ratio) | ~18–19% (Estimated FY27) | >11.5% | ⭐⭐⭐⭐⭐ | Excellent capital strength for future growth and stress scenarios. |
📊 Banking Ratio Scorecard
1️⃣ Net Interest Margin (NIM)
Current: ~3.4%
Interpretation
✅ Strong lending spread
✅ Stable core profitability
⚠ Slight pressure from higher deposit costs
Verdict
Healthy
⭐⭐⭐⭐☆
2️⃣ CASA Ratio
Current: ~32–34%
Strengths
✅ Large savings account base
✅ Low-cost funding
✅ Stable retail deposits
Watch
⚠ Improvement in CASA will help expand margins over time.
Verdict
Strong
⭐⭐⭐⭐☆
3️⃣ Gross NPA (GNPA)
Current: ~1.1–1.2%
Interpretation
- Lower than most large Indian banks.
- Reflects disciplined underwriting.
- Retail loan quality remains robust.
Verdict
Excellent
⭐⭐⭐⭐⭐
4️⃣ Net NPA (NNPA)
Current: ~0.3–0.4%
Interpretation
- High recovery efficiency.
- Strong provisioning policy.
- Very low-stressed assets.
Verdict
Excellent
⭐⭐⭐⭐⭐
5️⃣ Provision Coverage Ratio (PCR)
Current: ~67%
Interpretation
- Comfortable cushion against future defaults.
- Supports earnings stability during credit stress.
Verdict
Excellent
⭐⭐⭐⭐⭐
6️⃣ CET-1 Ratio
Estimated FY27: ~16.5–17.0%
Interpretation
- Strongest indicator of core capital quality.
- Significant buffer above RBI minimum norms.
- Supports future loan growth without immediate capital raising.
Verdict
World-Class
⭐⭐⭐⭐⭐
7️⃣ CRAR (Capital Adequacy Ratio)
Estimated FY27: ~18–19%
Interpretation
- Strong solvency position.
- Adequate capacity to absorb unexpected losses.
- Provides flexibility for business expansion.
Verdict
Excellent
⭐⭐⭐⭐⭐
📈 Banking Health Dashboard
| Banking Ratio | Status |
|---|---|
| NIM | 🟢 Healthy |
| CASA | 🟢 Strong |
| GNPA | 🟢 Excellent |
| NNPA | 🟢 Excellent |
| PCR | 🟢 Excellent |
| CET-1 | 🟢 Excellent |
| CRAR | 🟢 Excellent |
🏆 Banking Quality Score
| Parameter | Score |
|---|---|
| NIM | 9 / 10 |
| CASA | 9 / 10 |
| GNPA | 10 / 10 |
| NNPA | 10 / 10 |
| PCR | 10 / 10 |
| CET-1 | 10 / 10 |
| CRAR | 10 / 10 |
⭐ Overall Banking Ratio Score: 68 / 70 (97%)
🎯 Final Banking Verdict
Strengths
- ✅ Industry-leading asset quality with very low GNPA and NNPA.
- ✅ Strong provision coverage supports resilience in weaker credit cycles.
- ✅ Healthy NIM despite competitive deposit pricing.
- ✅ Robust capital position (CET-1 and CRAR) provides room for future growth.
- ✅ Large CASA franchise continues to be a structural competitive advantage.
Areas to Monitor
- ⚠ CASA growth should improve further after the HDFC Ltd merger integration.
- ⚠ Deposit costs and the interest-rate cycle will continue to influence NIM over the next few quarters.
- ⚠ Loan-to-Deposit Ratio (LDR) normalization remains an important management objective.
HDFC Ltd + HDFC Bank Merger Synergies Analysis (Updated FY27)
Merger Effective Date: 1 July 2023
The merger transformed HDFC Bank from a traditional private bank into a broader financial services platform by combining HDFC Ltd.’s housing finance business with HDFC Bank’s deposit franchise and distribution network. The combined entity aims to create value through larger scale, broader product offerings, stronger underwriting, and cross-selling opportunities.
📊 Overall Synergy Score
| Category | Score |
|---|---|
| Revenue Synergies | 9.5 / 10 |
| Cost Synergies | 8.5 / 10 |
| Funding Synergies | 9.5 / 10 |
| Technology Synergies | 9.0 / 10 |
| Cross-selling | 10 / 10 |
| Distribution Network | 10 / 10 |
| Capital Efficiency | 9.5 / 10 |
⭐ Overall Merger Synergy Score
65.5 / 70 (94%)
1️⃣ Revenue Synergies
Before Merger
- Home loans primarily through HDFC Ltd.
- Banking products through HDFC Bank.
- Limited customer integration.
After Merger
Customers Can Access
✅ Home Loans
✅ Savings Accounts
✅ Credit Cards
✅ Personal Loans
✅ Auto Loans
✅ Business Loans
✅ Insurance
✅ Mutual Funds
✅ Wealth Management
Revenue Impact
- Higher fee income.
- Larger customer wallet share.
- Better customer retention.
Rating: ⭐⭐⭐⭐⭐
The merger creates opportunities to cross-sell banking products to mortgage customers and vice versa, expanding revenue per customer.
2️⃣ Cost Synergies
Benefits
✅ Single technology platform
✅ Unified branch network
✅ Shared operations
✅ Better procurement
✅ Lower operating cost per customer
Expected Impact
- Improved Cost-to-Income Ratio.
- Better operating leverage.
- Higher long-term profitability.
Rating: ⭐⭐⭐⭐☆
3️⃣ Funding Synergies
Biggest Benefit
Before the merger, HDFC Ltd. largely relied on wholesale funding for housing finance.
After the merger:
- Home loans are increasingly funded through HDFC Bank’s low-cost CASA deposits.
- Funding costs decline over time.
- Profitability improves as the funding mix normalizes.
Long-Term Impact
- Lower cost of funds.
- Better Net Interest Margin (NIM).
- Higher Return on Assets (ROA).
Rating: ⭐⭐⭐⭐⭐
4️⃣ Technology Synergies
Improvements
✅ Unified mobile banking
✅ AI-based lending
✅ Single customer view
✅ Faster loan processing
✅ Digital document verification
✅ Better fraud detection
Management has highlighted that IT systems have been integrated, and customers now have a unified relationship view.
Rating
⭐⭐⭐⭐⭐
5️⃣ Cross-Selling Opportunities
Largest Synergy
Home Loan Customer
Can now receive
✅ Salary Account
✅ Credit Card
✅ Personal Loan
✅ Insurance
✅ SIP
✅ Demat Account
✅ Wealth Management
Banking Customer
Can now receive
✅ Home Loan
✅ LAP
✅ Mortgage Products
✅ Insurance
Expected Result
Higher customer lifetime value and stronger customer stickiness.
Rating: ⭐⭐⭐⭐⭐
6️⃣ Distribution Synergy
Combined Strength
- One of India’s largest branch networks.
- Strong digital channels.
- Extensive mortgage and banking reach.
- Wider rural and semi-urban presence.
Benefits
✅ More customers
✅ Lower acquisition cost
✅ Better penetration
Rating: ⭐⭐⭐⭐⭐
7️⃣ Capital Efficiency
Benefits
- Better capital allocation.
- Improved balance-sheet flexibility.
- Greater ability to fund long-term mortgages.
- Stronger lending capacity.
Rating: ⭐⭐⭐⭐⭐
8️⃣ Loan-to-Deposit Ratio (LDR) Improvement
One of the key post-merger challenges was the elevated Loan-to-Deposit Ratio (LDR) because the merged entity inherited a large mortgage book without an equivalent increase in deposits.
| Period | LDR Trend |
|---|---|
| Immediately after Merger | 🔴 Elevated |
| FY25 | 🟡 Improving |
| FY26 | 🟢 Further Improvement |
| FY27 Target | 85–90% |
Management continues to prioritize faster deposit growth than loan growth to normalize the balance sheet.
9️⃣ AI & Digital Synergies
AI Banking
- AI-powered underwriting.
- Fraud detection.
- Customer analytics.
- Personalized product recommendations.
Digital Banking
- Unified app ecosystem.
- Faster onboarding.
- Better digital customer experience.
Rating
⭐⭐⭐⭐⭐
🔟 Risks After Merger
Risks
⚠ Temporary NIM pressure due to deposit costs.
⚠ CASA ratio still normalizing.
⚠ Integration costs.
⚠ Higher regulatory capital requirements.
Mitigating Factors
- Strong deposit franchise.
- Conservative underwriting.
- Healthy capital adequacy.
- Gradual LDR improvement.
📊 Synergy Timeline
| Timeline | Expected Benefit |
|---|---|
| 1 Year | Deposit growth, technology integration, LDR improvement |
| 3 Years | Cross-selling, margin improvement, operating leverage |
| 5 Years | Full synergy realization, stronger profitability, improved ROE |
🎯 Long-Term Financial Impact
| Metric | Expected Impact |
|---|---|
| Loan Growth | 📈 Positive |
| Deposit Growth | 📈 Positive |
| NIM | 📈 Gradual Improvement |
| ROA | 📈 Positive |
| ROE | 📈 Positive |
| Cost-to-Income | 📉 Lower |
| EPS Growth | 📈 Higher |
| Intrinsic Value | 📈 Higher |
🏆 Final Merger Verdict
| Category | Rating |
|---|---|
| Revenue Synergy | ⭐⭐⭐⭐⭐ |
| Cost Synergy | ⭐⭐⭐⭐☆ |
| Funding Synergy | ⭐⭐⭐⭐⭐ |
| Technology | ⭐⭐⭐⭐⭐ |
| Cross-Selling | ⭐⭐⭐⭐⭐ |
| Distribution | ⭐⭐⭐⭐⭐ |
| Capital Efficiency | ⭐⭐⭐⭐⭐ |
🎯 Overall Verdict
Merger Synergy Rating: 94 / 100 ⭐⭐⭐⭐⭐
The HDFC Ltd.–HDFC Bank merger is proving to be strategically beneficial. The biggest long-term value drivers are:
- ✅ Low-cost funding of the mortgage book through HDFC Bank’s deposit franchise.
- ✅ Large cross-selling opportunity across banking, mortgages, insurance, and wealth management.
- ✅ Stronger technology integration and digital capabilities.
- ✅ Gradual normalization of the Loan-to-Deposit Ratio (LDR).
- ✅ Better operating leverage and capital efficiency over time.
While the transition temporarily pressured metrics such as LDR and margins, management’s focus on deposit-led growth suggests these effects should ease as integration matures.
HDFC Bank – Credit Growth Analysis (Updated FY27)
Company: HDFC Bank
What is Credit Growth?
Credit Growth measures how fast a bank’s loan book is increasing. It is one of the most important indicators for evaluating a bank because higher-quality loan growth generally leads to higher interest income and long-term earnings.
Q1 FY27 Credit Growth
| Metric | Q1 FY27 | YoY Growth | Rating |
|---|---|---|---|
| Gross Advances | ₹30.61 Lakh Crore | 15.4% | ⭐⭐⭐⭐⭐ |
| Advances Under Management | ₹31.27 Lakh Crore | 12.4% | ⭐⭐⭐⭐☆ |
| Retail Loans | Strong Growth | 🟢 | ⭐⭐⭐⭐⭐ |
| Corporate Loans | Stable Growth | 🟢 | ⭐⭐⭐⭐☆ |
| Commercial & Rural Banking | Healthy Growth | 🟢 | ⭐⭐⭐⭐☆ |
Overall Credit Growth Rating: ⭐⭐⭐⭐⭐
Loan Book Composition
| Segment | Outlook | Impact |
|---|---|---|
| Retail Loans | ⭐⭐⭐⭐⭐ | Very Positive |
| Home Loans | ⭐⭐⭐⭐⭐ | Very Positive |
| MSME Loans | ⭐⭐⭐⭐☆ | Positive |
| Corporate Banking | ⭐⭐⭐⭐☆ | Positive |
| Rural Banking | ⭐⭐⭐⭐☆ | Positive |
| Commercial Banking | ⭐⭐⭐⭐☆ | Positive |
Credit Growth Drivers
1. Home Loan Business
Following the HDFC Ltd merger:
- ✅ Largest mortgage franchise in India.
- ✅ Higher cross-selling opportunities.
- ✅ Strong housing demand.
Impact: ⭐⭐⭐⭐⭐
2. Retail Banking
Growth continues in:
- Personal Loans
- Auto Loans
- Credit Cards
- Education Loans
- Gold Loans
Impact: ⭐⭐⭐⭐⭐
3. Corporate Banking
- Large corporate lending remains healthy.
- Infrastructure financing opportunities continue.
- Manufacturing and capex recovery support demand.
Impact: ⭐⭐⭐⭐☆
4. MSME Lending
Government initiatives and increasing formalization of small businesses continue to support demand.
Impact: ⭐⭐⭐⭐☆
5. Digital Lending
AI and digital platforms are improving:
- Loan approval speed
- Customer acquisition
- Credit monitoring
Impact: ⭐⭐⭐⭐⭐
Credit Quality
| Parameter | Status |
|---|---|
| Loan Growth | 🟢 Strong |
| GNPA | 🟢 Very Low |
| NNPA | 🟢 Very Low |
| Slippages | 🟢 Controlled |
| Credit Cost | 🟢 Stable |
Verdict: Loan growth is being achieved without a major deterioration in asset quality, which is a positive sign for long-term investors.
FY27 Management Guidance
| Parameter | Expected Growth |
|---|---|
| Loan Growth | 13–15% |
| Deposit Growth | 14–16% |
| Retail Loans | Strong |
| Home Loans | Strong |
| Corporate Loans | Stable |
FY27 Credit Growth Outlook
Bull Case (25%)
- Loan Growth: 16–18%
- Strong housing demand
- Higher retail credit demand
- Stable NPAs
Rating: ⭐⭐⭐⭐⭐
Base Case (55%)
- Loan Growth: 13–15%
- Stable GDP growth
- Controlled NPAs
Rating: ⭐⭐⭐⭐☆
Bear Case (20%)
- Loan Growth: 8–10%
- Economic slowdown
- Higher credit costs
Rating: ⭐⭐⭐☆☆
Key Risks
⚠ Higher interest rates may reduce borrowing demand.
⚠ Slower economic growth could moderate corporate lending.
⚠ Intense competition in retail lending may pressure pricing.
Long-Term Outlook (2026–2031)
| Growth Driver | Impact |
|---|---|
| Housing Finance | ⭐⭐⭐⭐⭐ |
| Retail Banking | ⭐⭐⭐⭐⭐ |
| Digital Lending | ⭐⭐⭐⭐⭐ |
| MSME Growth | ⭐⭐⭐⭐☆ |
| Infrastructure Lending | ⭐⭐⭐⭐☆ |
| AI-Based Credit Assessment | ⭐⭐⭐⭐⭐ |
📊 Credit Growth Scorecard
| Parameter | Score |
|---|---|
| Loan Growth | 10 / 10 |
| Retail Banking | 10 / 10 |
| Home Loans | 10 / 10 |
| Corporate Banking | 9 / 10 |
| Asset Quality | 10 / 10 |
| Future Growth Potential | 10 / 10 |
🏆 Final Credit Growth Score
59 / 60 (98%) – Excellent
🎯 Investment View
- ✅ 15.4% YoY gross advances growth demonstrates strong demand across lending segments.
- ✅ The HDFC Ltd merger strengthens the bank’s leadership in mortgages and supports cross-selling opportunities.
- ✅ Asset quality remains strong despite healthy credit expansion.
- ✅ Management’s focus on balanced loan growth and deposit mobilization supports sustainable long-term profitability.
Verdict: HDFC Bank’s credit growth remains one of its strongest long-term investment drivers, supported by disciplined underwriting, a diversified loan book, and India’s structural credit expansion.
HDFC Bank – Deposit Franchise Analysis (Updated FY27)
Company: HDFC Bank
What is a Deposit Franchise?
A deposit franchise refers to a bank’s ability to consistently attract and retain customer deposits at a low cost. It is one of the strongest competitive advantages in banking because low-cost deposits help improve profitability and support long-term loan growth.
FY27 Deposit Franchise Snapshot
| Parameter | Latest Status | Rating |
|---|---|---|
| Total Deposits | ₹31.71 Lakh Crore | ⭐⭐⭐⭐⭐ |
| Deposit Growth (YoY) | 14.7% | ⭐⭐⭐⭐⭐ |
| CASA Deposits | ₹10.26 Lakh Crore | ⭐⭐⭐⭐☆ |
| CASA Ratio | ~32–34% | ⭐⭐⭐⭐☆ |
| Retail Deposits | Very Strong | ⭐⭐⭐⭐⭐ |
| Term Deposits | Healthy Growth | ⭐⭐⭐⭐☆ |
| Deposit Diversification | Excellent | ⭐⭐⭐⭐⭐ |
Why HDFC Bank’s Deposit Franchise is Strong
1️⃣ Massive Retail Customer Base
- ✅ 10+ crore customers.
- ✅ Salary accounts.
- ✅ Savings accounts.
- ✅ Current accounts.
- ✅ Senior citizen deposits.
- ✅ NRI deposits.
Impact: Stable and recurring deposit inflows.
Rating: ⭐⭐⭐⭐⭐
2️⃣ CASA Franchise
CASA = Current Account + Savings Account
| Metric | Status |
|---|---|
| CASA Deposits | ₹10.26 Lakh Crore |
| CASA Ratio | ~32–34% |
Why CASA Matters
- Lower cost of funds.
- Higher Net Interest Margin (NIM).
- More stable deposits.
Verdict
🟢 One of India’s strongest CASA franchises, though management continues to focus on improving the ratio after the merger.
Rating: ⭐⭐⭐⭐☆
3️⃣ Deposit Growth
| Year | Trend |
|---|---|
| FY24 | Good |
| FY25 | Improving |
| Q1 FY27 | 14.7% YoY |
Analysis
- Deposit growth is now keeping pace with credit growth.
- This supports gradual improvement in the Loan-to-Deposit Ratio (LDR).
- Reduces dependence on higher-cost wholesale funding.
Rating: ⭐⭐⭐⭐⭐
4️⃣ Funding Cost Advantage
Before Merger
- HDFC Ltd relied more on wholesale funding.
After Merger
- Mortgage lending is increasingly funded through HDFC Bank’s deposit base.
- Lower long-term funding cost.
- Better profitability potential.
Impact: ⭐⭐⭐⭐⭐
5️⃣ Deposit Mix
| Deposit Type | Quality |
|---|---|
| Savings Account | ⭐⭐⭐⭐⭐ |
| Current Account | ⭐⭐⭐⭐☆ |
| Fixed Deposits | ⭐⭐⭐⭐⭐ |
| Retail Deposits | ⭐⭐⭐⭐⭐ |
| Corporate Deposits | ⭐⭐⭐⭐☆ |
| NRI Deposits | ⭐⭐⭐⭐☆ |
Verdict
A well-diversified deposit base reduces concentration risk and supports funding stability.
Competitive Comparison
| Bank | Deposit Franchise | Rating |
|---|---|---|
| HDFC Bank | Excellent | ⭐⭐⭐⭐⭐ |
| ICICI Bank | Excellent | ⭐⭐⭐⭐☆ |
| State Bank of India | Excellent | ⭐⭐⭐⭐⭐ |
| Axis Bank | Strong | ⭐⭐⭐⭐☆ |
| Kotak Mahindra Bank | Strong | ⭐⭐⭐⭐☆ |
Strengths
✅ Large and diversified retail deposit base.
✅ Strong CASA franchise.
✅ Consistent double-digit deposit growth.
✅ Low-cost funding supports profitability.
✅ Strong customer trust and brand.
Risks
⚠ Intense competition for deposits may increase funding costs.
⚠ CASA ratio is still below pre-merger levels and remains a key metric to watch.
⚠ Interest-rate changes can influence customer preferences between savings and term deposits.
FY27 Management Focus
Priority Areas
- Increase retail deposits.
- Improve CASA ratio.
- Reduce the Loan-to-Deposit Ratio (LDR).
- Maintain a stable funding mix.
- Expand digital deposit acquisition.
Long-Term Outlook (2026–2031)
| Driver | Impact |
|---|---|
| Retail Deposit Growth | ⭐⭐⭐⭐⭐ |
| CASA Expansion | ⭐⭐⭐⭐☆ |
| Digital Banking | ⭐⭐⭐⭐⭐ |
| Branch Expansion | ⭐⭐⭐⭐☆ |
| Cross-selling | ⭐⭐⭐⭐⭐ |
| Funding Cost Reduction | ⭐⭐⭐⭐⭐ |
📊 Deposit Franchise Scorecard
| Parameter | Score |
|---|---|
| Deposit Growth | 10 / 10 |
| CASA Quality | 9 / 10 |
| Funding Cost | 10 / 10 |
| Deposit Diversification | 10 / 10 |
| Customer Franchise | 10 / 10 |
| Long-Term Sustainability | 10 / 10 |
🏆 Final Deposit Franchise Score
59 / 60 (98%) – Excellent
🎯 Investment View
Key Strengths
- ✅ ₹31.71 lakh crore deposit base provides a strong foundation for future loan growth.
- ✅ 14.7% YoY deposit growth indicates healthy customer confidence.
- ✅ A large retail deposit franchise gives HDFC Bank a durable competitive advantage.
- ✅ Continued focus on CASA improvement and LDR normalization should strengthen profitability over time.
Final Verdict
HDFC Bank’s deposit franchise is one of the strongest in the Indian banking industry. Its large, diversified, and relatively low-cost deposit base provides a durable competitive moat, supports sustainable credit growth, and enhances long-term earnings quality.
🏦 HDFC Bank – Retail vs Corporate Loan Mix Analysis (Updated FY27)
Company: HDFC Bank
Loan Book Composition (FY27)
| Loan Segment | Approx. Share | Rating |
|---|---|---|
| Retail Loans | 58–60% | ⭐⭐⭐⭐⭐ |
| Corporate & Wholesale Loans | 40–42% | ⭐⭐⭐⭐☆ |
Overall Loan Mix
🟢 Retail Focused Bank
The HDFC Ltd merger has further strengthened the retail mortgage portfolio, while the corporate book remains diversified across industries.
📊 Retail Loan Portfolio
| Product | Outlook | Rating |
|---|---|---|
| Home Loans | ⭐⭐⭐⭐⭐ | ⭐⭐⭐⭐⭐ |
| Personal Loans | ⭐⭐⭐⭐☆ | ⭐⭐⭐⭐☆ |
| Auto Loans | ⭐⭐⭐⭐☆ | ⭐⭐⭐⭐☆ |
| Credit Cards | ⭐⭐⭐⭐⭐ | ⭐⭐⭐⭐⭐ |
| Gold Loans | ⭐⭐⭐⭐☆ | ⭐⭐⭐⭐☆ |
| Education Loans | ⭐⭐⭐⭐☆ | ⭐⭐⭐⭐☆ |
| Loan Against Property | ⭐⭐⭐⭐☆ | ⭐⭐⭐⭐☆ |
Retail Strengths
✅ Largest home loan franchise after the merger.
✅ Large salary-account customer base.
✅ Strong cross-selling opportunities.
✅ Better risk diversification.
✅ Higher customer lifetime value.
Risks
⚠ Personal loan growth needs monitoring.
⚠ Consumer spending slowdown could affect unsecured lending.
🏢 Corporate Loan Portfolio
| Segment | Outlook | Rating |
|---|---|---|
| Large Corporate | ⭐⭐⭐⭐☆ | ⭐⭐⭐⭐☆ |
| MSME | ⭐⭐⭐⭐⭐ | ⭐⭐⭐⭐⭐ |
| Commercial Banking | ⭐⭐⭐⭐☆ | ⭐⭐⭐⭐☆ |
| Infrastructure | ⭐⭐⭐⭐☆ | ⭐⭐⭐⭐☆ |
| Working Capital | ⭐⭐⭐⭐☆ | ⭐⭐⭐⭐☆ |
| Trade Finance | ⭐⭐⭐⭐⭐ | ⭐⭐⭐⭐⭐ |
Corporate Strengths
✅ Diversified corporate exposure.
✅ Conservative underwriting.
✅ Low-stressed assets.
✅ Strong relationships with large Indian companies.
Risks
⚠ Corporate credit demand depends on the economic cycle.
⚠ Infrastructure loans require careful risk monitoring.
Retail vs Corporate Comparison
| Parameter | Retail Loans | Corporate Loans |
|---|---|---|
| Loan Share | 58–60% | 40–42% |
| Growth Potential | ⭐⭐⭐⭐⭐ | ⭐⭐⭐⭐☆ |
| Risk Level | 🟢 Low–Moderate | Moderate |
| NPA Risk | Lower | Moderate |
| Profitability | Higher | Stable |
| Cross-selling | Excellent | Moderate |
| AI Opportunity | Very High | High |
Credit Quality by Segment
| Segment | Asset Quality |
|---|---|
| Home Loans | ⭐⭐⭐⭐⭐ |
| Retail Banking | ⭐⭐⭐⭐⭐ |
| MSME | ⭐⭐⭐⭐☆ |
| Corporate Banking | ⭐⭐⭐⭐☆ |
| Infrastructure | ⭐⭐⭐⭐☆ |
Verdict
The retail portfolio continues to have better asset quality than the corporate book, while corporate lending provides diversification and supports balanced earnings.
Growth Outlook (2026–2031)
Retail Banking
Expected CAGR:
13–16%
Growth Drivers:
- Housing demand
- Rising middle class
- Credit cards
- Personal finance
- Digital lending
Corporate Banking
Expected CAGR:
10–12%
Growth Drivers:
- Manufacturing
- Infrastructure
- MSME expansion
- Corporate capex
- Trade finance
AI Impact
Retail Banking
- AI-based credit scoring.
- Instant digital loan approvals.
- Personalized offers.
- Fraud detection.
Impact: ⭐⭐⭐⭐⭐
Corporate Banking
- AI-powered cash-flow analysis.
- Early warning systems.
- Automated risk monitoring.
- Smarter credit underwriting.
Impact: ⭐⭐⭐⭐☆
Portfolio Diversification
| Loan Category | Risk |
|---|---|
| Retail | 🟢 Low |
| Corporate | Moderate |
| MSME | Moderate |
| Home Loans | 🟢 Low |
| Credit Cards | 🟡 Medium |
Scorecard
| Parameter | Score |
|---|---|
| Retail Franchise | 10 / 10 |
| Corporate Banking | 9 / 10 |
| Diversification | 10 / 10 |
| Asset Quality | 10 / 10 |
| Growth Potential | 10 / 10 |
| Risk Management | 10 / 10 |
🏆 Final Retail vs Corporate Loan Mix Score
59 / 60 (98%) – Excellent
🎯 Investment Verdict
Retail Loan Strengths
- ✅ Retail loans account for roughly 58–60% of the portfolio, providing diversified and relatively stable earnings.
- ✅ The HDFC Ltd merger has reinforced HDFC Bank’s leadership in the home-loan segment.
- ✅ Cross-selling across banking, mortgages, insurance, and wealth management enhances customer value.
Corporate Loan Strengths
- ✅ Corporate and wholesale loans contribute about 40–42%, offering balanced exposure to large companies, MSMEs, and trade finance.
- ✅ Conservative underwriting and diversified sector exposure help manage credit risk.
Overall Conclusion
HDFC Bank maintains a well-balanced loan mix. A dominant retail franchise supports long-term growth and asset quality, while a diversified corporate portfolio contributes stable earnings and business diversification. This combination remains one of the bank’s key competitive strengths.
🏦 HDFC Bank – RBI Regulatory Impact Analysis (Updated FY27)
Company: HDFC Bank
RBI Regulatory Impact Score
| Regulatory Area | Impact | Score |
|---|---|---|
| CRR & SLR | Moderate | 9 / 10 |
| Repo Rate Policy | Moderate | 8.5 / 10 |
| Basel III Compliance | Very Positive | 10 / 10 |
| Capital Adequacy (CRAR) | Strong | 10 / 10 |
| CET-1 Requirement | Strong | 10 / 10 |
| Liquidity (LCR/NSFR) | Strong | 10 / 10 |
| Priority Sector Lending (PSL) | Positive | 9 / 10 |
| Digital Banking Regulations | Positive | 9 / 10 |
| Cyber Security Compliance | Positive | 9 / 10 |
| Consumer Protection Rules | Neutral | 8.5 / 10 |
⭐ Overall RBI Regulatory Score
93 / 100 – Excellent
1️⃣ Repo Rate Impact
If the RBI increases the repo rate
Positive
✅ Higher lending rates
✅ Better interest income on floating-rate loans
Negative
⚠ Higher deposit costs
⚠ Slower retail credit demand
⚠ Temporary pressure on NIM
Overall Impact
🟡 Moderate
If the RBI cuts the repo rate
Positive
✅ Higher home loan demand
✅ Stronger retail credit growth
✅ Higher corporate borrowing
Negative
⚠ Slight NIM compression
Overall Impact
🟢 Positive
2️⃣ CRR (Cash Reserve Ratio)
RBI Requirement
Banks must keep a portion of deposits with the RBI.
Impact on HDFC Bank
Positive
- Strong liquidity position.
- Comfortable compliance.
Negative
- Higher CRR reduces funds available for lending.
Risk Level
🟢 Low
3️⃣ SLR (Statutory Liquidity Ratio)
Impact
HDFC Bank maintains investments in government securities to comply with SLR requirements.
Benefits
✅ High liquidity
✅ Lower balance-sheet risk
Drawback
⚠ Slight reduction in loanable funds.
4️⃣ Basel III Regulations
HDFC Bank Position
| Parameter | Status |
|---|---|
| CET-1 | 🟢 Strong |
| CRAR | 🟢 Strong |
| Leverage Ratio | 🟢 Healthy |
| Liquidity Coverage Ratio | 🟢 Comfortable |
| Net Stable Funding Ratio | 🟢 Strong |
Impact
✅ Better financial stability.
✅ Lower bankruptcy risk.
✅ Strong investor confidence.
5️⃣ Priority Sector Lending (PSL)
RBI requires banks to lend to:
- Agriculture
- MSMEs
- Education
- Affordable Housing
- Weaker Sections
HDFC Bank
✅ Strong compliance.
Benefits
- Larger customer base.
- Long-term franchise expansion.
Challenges
⚠ Margins can be lower than commercial lending.
6️⃣ Digital Banking Regulations
RBI Focus
- Digital Payments
- UPI
- KYC
- Account Aggregator
- Digital Lending
- Data Privacy
Impact
Positive
✅ Better customer trust.
✅ Faster digital onboarding.
✅ Higher digital transactions.
Negative
⚠ Higher compliance costs.
7️⃣ Cyber Security Regulations
RBI Expectations
- Real-time fraud detection.
- Data encryption.
- Cyber resilience.
- Customer data protection.
HDFC Bank Position
✅ Strong technology investment.
✅ AI-powered fraud detection.
Risk
🟢 Low
8️⃣ Consumer Protection
RBI Focus
- Transparent pricing.
- Fair lending practices.
- Faster grievance redressal.
- Responsible recovery.
Impact
Positive
- Higher customer trust.
- Stronger brand reputation.
Negative
- Increased compliance requirements.
9️⃣ Merger-Related Regulatory Impact
Following the HDFC Ltd merger:
RBI Focus Areas
- Loan-to-Deposit Ratio (LDR)
- Liquidity Management
- Capital Adequacy
- Provisioning
- Risk Governance
Current Position
| Parameter | Status |
|---|---|
| LDR | Improving |
| Capital | Strong |
| Liquidity | Strong |
| Asset Quality | Excellent |
🔟 Future RBI Regulations (2026–2031)
Likely Focus
AI Governance
- AI risk controls.
- Responsible AI usage.
Climate Risk
- ESG disclosures.
- Green finance.
Digital Rupee (CBDC)
- Wider adoption.
- Banking integration.
Cyber Security
- Stronger digital resilience.
Open Banking
- API ecosystem expansion.
Regulatory Risk Matrix
| Regulation | Risk | Opportunity |
|---|---|---|
| Repo Rate | 🟡 Medium | ⭐⭐⭐⭐☆ |
| CRR | 🟢 Low | ⭐⭐⭐⭐☆ |
| SLR | 🟢 Low | ⭐⭐⭐⭐☆ |
| Basel III | 🟢 Low | ⭐⭐⭐⭐⭐ |
| Digital Lending | 🟡 Medium | ⭐⭐⭐⭐⭐ |
| Cyber Security | 🟡 Medium | ⭐⭐⭐⭐⭐ |
| Consumer Protection | 🟢 Low | ⭐⭐⭐⭐☆ |
| AI Regulation | 🟡 Medium | ⭐⭐⭐⭐☆ |
Long-Term Regulatory Outlook
| Factor | Impact |
|---|---|
| Digital Banking | ⭐⭐⭐⭐⭐ |
| Financial Inclusion | ⭐⭐⭐⭐⭐ |
| Housing Finance | ⭐⭐⭐⭐⭐ |
| AI Banking | ⭐⭐⭐⭐☆ |
| Capital Requirements | ⭐⭐⭐⭐☆ |
| ESG & Climate Finance | ⭐⭐⭐⭐☆ |
📊 RBI Regulatory Scorecard
| Category | Score |
|---|---|
| Capital Compliance | 10 / 10 |
| Liquidity Compliance | 10 / 10 |
| Digital Compliance | 9 / 10 |
| Risk Management | 10 / 10 |
| Consumer Protection | 9 / 10 |
| Basel Compliance | 10 / 10 |
| Future Readiness | 9 / 10 |
🏆 Final RBI Regulatory Score
67 / 70 (96%) – Excellent
🎯 Investment Verdict
Strengths
- ✅ Strong capital adequacy and CET-1 ratios provide a comfortable buffer above regulatory minimums.
- ✅ Well-positioned to meet Basel III requirements.
- ✅ Robust liquidity management supports business expansion.
- ✅ Continued investment in digital banking and cybersecurity aligns with RBI’s regulatory direction.
- ✅ Effective governance and risk controls reduce regulatory risk.
Key Risks to Monitor
- ⚠ Changes in RBI’s interest-rate policy can influence NIM and loan demand.
- ⚠ Any tightening of capital or liquidity norms could temporarily affect profitability.
- ⚠ Evolving rules for digital lending, AI governance, and consumer protection may increase compliance costs.
Overall Conclusion
HDFC Bank is one of the best-positioned Indian banks from a regulatory perspective. Its strong balance sheet, disciplined risk management, and proactive compliance culture mean RBI regulations are more likely to influence the pace of growth and profitability than threaten the underlying business model.
HDFC Bank – Updated Intrinsic Value & Fair Value Analysis (FY27)
Updated after Q1 FY27 business update and current market price (~₹825).
📊 Valuation Summary
| Valuation Method | Estimated Value | Weight | Verdict |
|---|---|---|---|
| P/B Multiple Valuation | ₹890 | 25% | Fair |
| Excess Return Model | ₹920 | 30% | Fair |
| Dividend Discount Model (DDM) | ₹875 | 15% | Conservative |
| Residual Income Model | ₹940 | 15% | Positive |
| Comparable Valuation | ₹930 | 15% | Fair |
🎯 Updated Intrinsic Value
₹920 per share
Fair Value Range
| Zone | Price Range | Action |
|---|---|---|
| 🟢 Strong Buy Zone | Below ₹780 | Buy Aggressively |
| 🟢 Buy Zone | ₹780 – ₹850 | Buy |
| 🟡 SIP / Accumulation Zone | ₹850 – ₹920 | Gradual Buying |
| ⚪ Fair Value Zone | ₹920 – ₹980 | Hold / SIP |
| 🟠 Expensive Zone | ₹980 – ₹1,050 | Avoid Fresh Buying |
| 🔴 Overvalued Zone | Above ₹1,050 | Profit Booking / Wait |
Margin of Safety
| Market Price | Intrinsic Value | Margin of Safety |
|---|---|---|
| ₹825 | ₹920 | ~10% |
Verdict
🟢 Moderately Undervalued
The current market price offers a modest margin of safety based on this valuation framework.
Valuation Sensitivity Analysis
| Long-Term Growth Assumption | Estimated Intrinsic Value |
|---|---|
| 10% | ₹860 |
| 12% | ₹920 |
| 14% | ₹980 |
| 16% | ₹1,050 |
AI-Based Fair Value Outlook
| Financial Year | Estimated Fair Value |
|---|---|
| FY27 | ₹920 |
| FY28 | ₹1,030 |
| FY29 | ₹1,160 |
| FY30 | ₹1,300 |
| FY31 | ₹1,450–₹1,550 |
These are scenario-based estimates assuming HDFC Bank maintains healthy earnings growth, stable asset quality, and strong capital discipline. They are not guaranteed future prices.
Key Assumptions Behind Valuation
Positive Factors
- ✅ Loan growth of 13–15% CAGR
- ✅ Deposit growth of 14–16% CAGR
- ✅ Stable NIM around 3.4–3.5%
- ✅ GNPA below 1.3%
- ✅ ROE maintained around 15–17%
- ✅ Successful HDFC Ltd merger integration
- ✅ Continued digital banking and AI adoption
Risks
- ⚠ Faster-than-expected NIM compression.
- ⚠ Slower credit growth during an economic slowdown.
- ⚠ Higher funding costs due to intense deposit competition.
- ⚠ Regulatory changes affecting capital requirements.
Updated Investment Zones
| Price Range | Recommendation | Conviction |
|---|---|---|
| < ₹780 | 🟢 Strong Buy | ⭐⭐⭐⭐⭐ |
| ₹780 – ₹850 | 🟢 Buy | ⭐⭐⭐⭐⭐ |
| ₹850 – ₹920 | 🟡 SIP / Accumulate | ⭐⭐⭐⭐☆ |
| ₹920 – ₹980 | ⚪ Hold | ⭐⭐⭐⭐☆ |
| ₹980 – ₹1,050 | 🟠 Reduce Fresh Buying | ⭐⭐⭐☆☆ |
| > ₹1,050 | 🔴 Wait / Partial Profit Booking | ⭐⭐☆☆☆ |
Valuation Score
| Category | Score |
|---|---|
| Intrinsic Value | 9.5 / 10 |
| Margin of Safety | 8.5 / 10 |
| Growth Visibility | 9.5 / 10 |
| Asset Quality | 10 / 10 |
| Capital Strength | 10 / 10 |
🏆 Overall Valuation Score
47.5 / 50 (95%) – Excellent
🎯 Final Valuation Verdict
Current Price (Approx.)
₹825
Updated Intrinsic Value
₹920
Fair Value Range
₹900 – ₹980
Long-Term Investment View
- ✅ The stock appears modestly undervalued based on this framework.
- ✅ The ₹780–₹850 range remains attractive for long-term accumulation.
- ✅ Prices below ₹780 would provide a significantly larger margin of safety.
- ✅ If the stock trades above ₹980, expected future returns may become more dependent on earnings growth than valuation expansion.
Recommendation: ⭐⭐⭐⭐⭐ BUY
Investment Horizon: 10–20+ Years
Preferred Strategy: Accumulate gradually in the ₹780–₹850 range and add more aggressively during broader market corrections if prices move below ₹780.
HDFC Bank – Quarterly Monitoring Checklist (Professional Investor Framework)
Objective: Har quarterly result (Q1, Q2, Q3, Q4) ke baad is checklist ko use karke HDFC Bank ki quality, growth aur valuation evaluate karein.
🟢 1. Business Growth (20 Marks)
| KPI | Healthy Level | Current Trend | Status |
|---|---|---|---|
| Loan Growth | >13% YoY | ⬜ | |
| Deposit Growth | >14% YoY | ⬜ | |
| CASA Deposit Growth | >10% YoY | ⬜ | |
| Retail Loan Growth | >15% YoY | ⬜ | |
| Corporate Loan Growth | >10% YoY | ⬜ | |
| Fee Income Growth | >12% YoY | ⬜ |
Verdict
- 🟢 Excellent
- 🟡 Stable
- 🔴 Weak
🟢 2. Profitability (15 Marks)
| KPI | Healthy Level | Status |
|---|---|---|
| Net Profit Growth | >12% | ⬜ |
| Net Interest Income (NII) | >10% | ⬜ |
| Operating Profit | Growing | ⬜ |
| EPS Growth | >12% | ⬜ |
| Cost-to-Income Ratio | Stable / Lower | ⬜ |
🟢 3. Banking Ratios (20 Marks)
| Ratio | Ideal Value | Status |
|---|---|---|
| NIM | >3.3% | ⬜ |
| CASA Ratio | >33% | ⬜ |
| GNPA | <1.30% | ⬜ |
| NNPA | <0.40% | ⬜ |
| PCR | >65% | ⬜ |
| CET-1 | >15% | ⬜ |
| CRAR | >17% | ⬜ |
| Credit Cost | Stable / Lower | ⬜ |
🟢 4. Balance Sheet Strength (10 Marks)
| KPI | Ideal | Status |
|---|---|---|
| Deposit Franchise | Improving | ⬜ |
| Loan-to-Deposit Ratio (LDR) | 85–90% | ⬜ |
| Liquidity Coverage Ratio (LCR) | Strong | ⬜ |
| Provision Buffer | Strong | ⬜ |
| Capital Buffer | Strong | ⬜ |
🟢 5. Asset Quality (10 Marks)
| KPI | Ideal | Status |
|---|---|---|
| Slippages | Low | ⬜ |
| Write-offs | Controlled | ⬜ |
| Restructured Book | Low | ⬜ |
| Recovery Rate | Improving | ⬜ |
| SMA Accounts | Stable | ⬜ |
🟢 6. Management Commentary (10 Marks)
Check whether management discusses:
☐ Deposit Growth
☐ Loan Growth
☐ CASA Strategy
☐ NIM Outlook
☐ Credit Cost Guidance
☐ Asset Quality
☐ AI & Digital Banking
☐ Merger Synergies
☐ Cross-selling
☐ Future Guidance
🟢 7. Merger Synergy Tracking (10 Marks)
| KPI | Target | Status |
|---|---|---|
| Cross-selling Growth | Improving | ⬜ |
| Mortgage Growth | Strong | ⬜ |
| Deposit Synergies | Improving | ⬜ |
| LDR Improvement | Improving | ⬜ |
| Cost Synergies | Improving | ⬜ |
🟢 8. Digital & AI Progress (5 Marks)
| KPI | Target | Status |
|---|---|---|
| Mobile Banking Users | Increasing | ⬜ |
| AI Adoption | Improving | ⬜ |
| Digital Transactions | Growing | ⬜ |
| Cost Automation | Improving | ⬜ |
| Fraud Detection | Strong | ⬜ |
🟢 9. Valuation Check (5 Marks)
| KPI | Status |
|---|---|
| Intrinsic Value Updated | ⬜ |
| Fair Value Updated | ⬜ |
| Margin of Safety Checked | ⬜ |
| P/B Compared with History | ⬜ |
| Peer Valuation Compared | ⬜ |
🟢 10. Technical & Institutional Check (5 Marks)
| KPI | Status |
|---|---|
| Price Above 200 EMA | ⬜ |
| RSI Healthy (45–70) | ⬜ |
| Volume Confirmation | ⬜ |
| FII Holding | ⬜ |
| DII Holding | ⬜ |
| Mutual Fund Holding | ⬜ |
🚨 Red Flag Checklist
Take extra caution if any of the following occur:
- ⛔ Loan Growth falls below 10%
- ⛔ Deposit Growth falls below 10%
- ⛔ NIM drops below 3.2%
- ⛔ CASA Ratio falls below 30%
- ⛔ GNPA rises above 1.5%
- ⛔ NNPA rises above 0.6%
- ⛔ PCR falls below 60%
- ⛔ CET-1 falls below 14%
- ⛔ Management lowers guidance significantly
- ⛔ Major RBI regulatory action
- ⛔ Unexpected deterioration in merger execution
📊 Quarterly Scorecard
| Category | Max Marks |
|---|---|
| Business Growth | 20 |
| Profitability | 15 |
| Banking Ratios | 20 |
| Balance Sheet | 10 |
| Asset Quality | 10 |
| Management Commentary | 10 |
| Merger Synergies | 10 |
| Digital & AI | 5 |
| Valuation | 5 |
| Technical & Institutional | 5 |
Total Score: 110 Marks
🏆 Quarterly Rating
| Score | Rating | Decision |
|---|---|---|
| 100–110 | ⭐⭐⭐⭐⭐ | Strong Buy |
| 90–99 | ⭐⭐⭐⭐☆ | Buy |
| 80–89 | ⭐⭐⭐⭐ | Accumulate |
| 70–79 | ⭐⭐⭐ | Hold |
| Below 70 | ⭐⭐ | Review / Avoid Fresh Buying |
⚠️ Disclaimer
The information, analysis, opinions, valuation models, intrinsic value estimates, fair value ranges, and investment scores presented in this report are intended solely for educational and informational purposes. This report should not be considered as financial, investment, legal, tax, or professional advice.
The intrinsic value, DCF/Excess Return valuation, Reverse DCF assumptions, and future price estimates are based on publicly available financial information, historical performance, reasonable assumptions, and analytical models. Actual business performance, market conditions, regulatory changes, interest rate movements, macroeconomic developments, and unforeseen events may cause actual results to differ materially from these estimates.
Past performance does not guarantee future returns. Equity investments are subject to market risks, including the possible loss of capital. Investors should conduct their own independent research, review the latest financial statements, quarterly results, annual reports, exchange filings, and consult a SEBI-registered investment adviser or qualified financial professional before making any investment decisions.
Neither the author nor the publisher accepts any responsibility or liability for any financial loss or investment decisions made based on this report.
📌 Research Methodology
This report is prepared using a combination of:
- Fundamental Analysis
- Value Investing Principles
- Business Quality Assessment
- Economic Moat Analysis
- Management & Corporate Governance Review
- Financial Statement Analysis
- Banking-Specific Ratio Analysis (NIM, CASA, GNPA, NNPA, PCR, CET-1, CRAR)
- Intrinsic Value & Excess Return Valuation
- Relative Valuation (P/B, P/E)
- Macro & Industry Analysis
- Risk Assessment
- Technical Confirmation
- Institutional Shareholding Analysis
- AI-Assisted Research Framework
⚖️ Risk Disclosure
Investing in equities involves risks, including, but not limited to:
- Market Risk
- Business Risk
- Credit Risk
- Interest Rate Risk
- Regulatory Risk
- Liquidity Risk
- Currency Risk
- Geopolitical Risk
Investors should ensure that any investment is suitable for their financial goals, investment horizon, and risk tolerance.
© Copyright Notice
© 2026 All Rights Reserved.
This research report is the intellectual property of GBullsNBears Research. No part of this report may be copied, reproduced, distributed, or published in any form without prior written permission from the author, except for brief quotations with appropriate attribution.
⭐ Final Note
“Buy great businesses at reasonable prices, stay invested for the long term, and let the power of compounding work in your favor. Successful investing requires discipline, patience, and continuous learning—not speculation.”