
Introduction: Why Did the Indian Stock Market Crash?
Indian equity markets faced intense selling pressure on Thursday, 8 October 2026, as rising crude oil prices, foreign investor outflows and the Reserve Bank of India’s hawkish policy stance combined to weaken investor confidence.
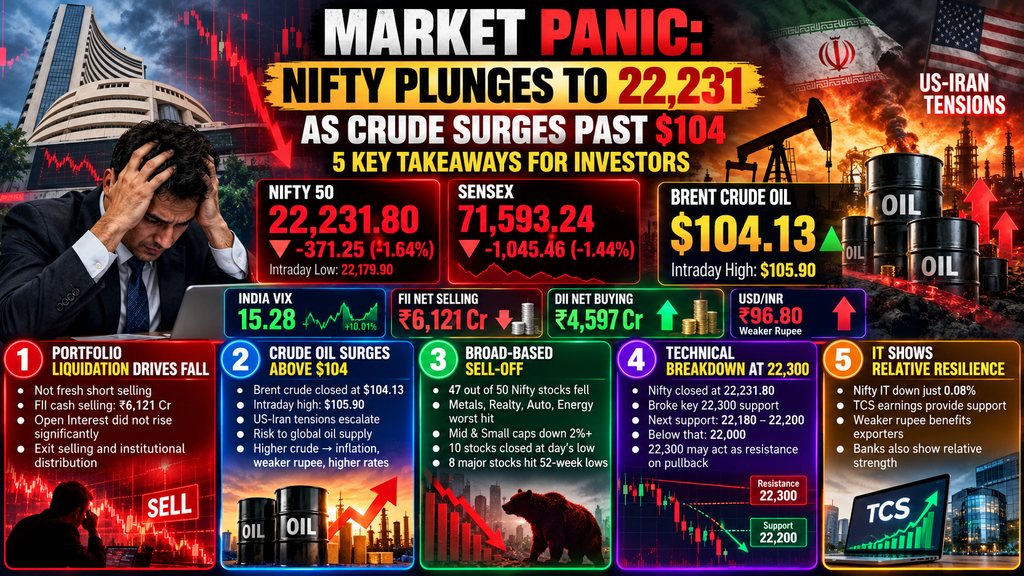
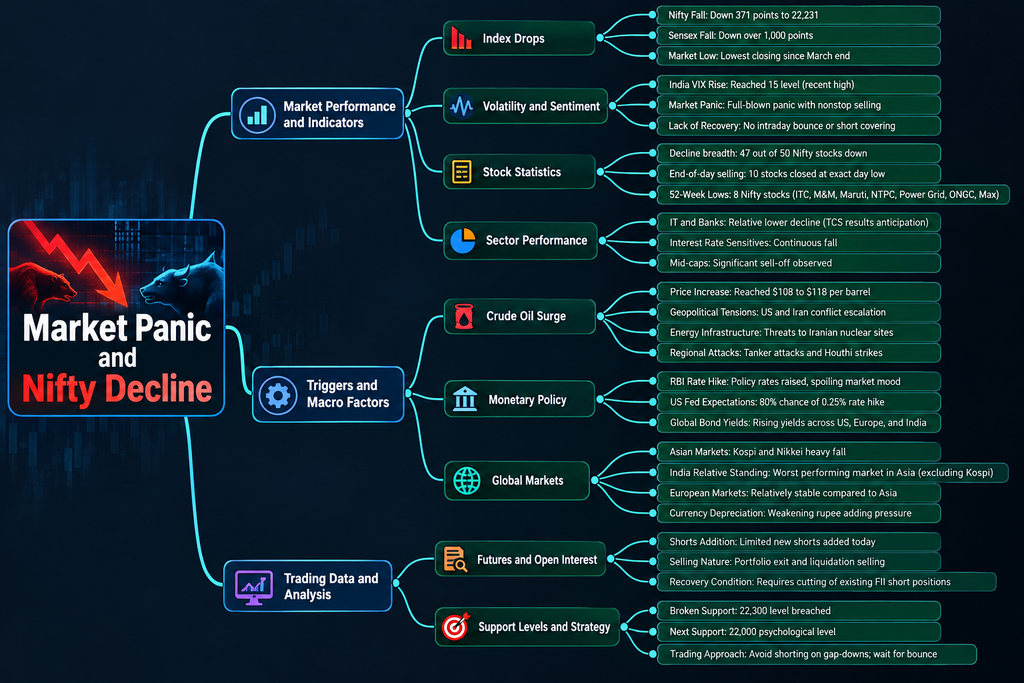
The Nifty 50 fell 371.25 points, or 1.64%, to close at 22,231.80, while the Sensex dropped 1,045.46 points, or 1.44%, to finish at 71,593.24. The Nifty also touched an intraday low of 22,179.90, its lowest level in roughly 18 months.
The sell-off followed the RBI’s decision on 7 October to increase its repo rate by 25 basis points to 5.50% and shift its policy stance from neutral to calibrated tightening. Meanwhile, Brent crude climbed above $104 amid renewed Middle East supply concerns.
The result was a difficult combination for Indian markets:
- Higher borrowing costs and inflation risks.
- A weakening rupee and pressure on foreign capital flows.
- Broad-based selling across sectors.
- Rising volatility and a breakdown below the 22,300 support zone.
The key question for investors is whether this is a temporary correction or the start of a deeper market downturn. The answer will depend on crude oil, foreign flows, corporate earnings and the Nifty’s ability to stabilise after breaking major support.
1. Takeaway One: This Looks Like a Broad Risk-Off Sell-Off, Not Just Fresh Short Selling
Market crashes are often blamed on aggressive short sellers. However, falling prices alone cannot tell us whether traders are opening new shorts or institutional investors are selling their existing holdings.
To distinguish between these possibilities, investors need to examine futures open interest, price changes, FII index positioning and cash-market flows together.
What the latest cash-market data tells us
FII/FPI net selling · 8 Oct
₹6,121 Cr
DII net buying · 8 Oct
₹4,597 Cr
Rounded figures. Net cash-market activity, not total derivatives exposure.
Even though domestic institutional investors bought shares, their purchases did not prevent the benchmark indices from falling sharply.
This tells us that domestic demand was insufficient to offset the day’s selling pressure.
However, it would be premature to declare that the entire decline was caused by portfolio liquidation rather than fresh short positions without checking the relevant derivatives data.
What traders should monitor
- Price falls + open interest rises: can indicate fresh short creation, depending on contract-level positioning.
- Price falls + open interest falls: can indicate long unwinding.
- FII cash selling accelerates: confirms pressure from foreign portfolio outflows.
- Price stabilises + short positions unwind: may support a relief rally, but does not guarantee a lasting bottom.
The most important takeaway is that a sustainable recovery needs evidence of reduced selling pressure—not simply a lower index price.
2. Takeaway Two: Crude Oil Is Turning Into a Major Risk for Indian Equities
The immediate global catalyst was the sharp rise in crude oil prices.
On 8 October, Brent crude rose amid renewed fears of supply disruption in the Middle East. Reports placed the intraday price near $105.90, while the benchmark settled around $104.13 per barrel.
This is an important distinction: the article’s original claim of crude settling above $108 is not supported by the available closing-price data.

Why does crude oil matter so much to India?
India imports a substantial share of its crude oil requirements. Higher oil prices can put pressure on several parts of the economy simultaneously.
Crude oil prices rise.
Import bill and inflation pressure increase
Rupee and interest-rate risks increase
Equity valuations and investor sentiment come under pressure
This chain is not automatic, but it explains why sustained high oil prices can be particularly damaging for an oil-importing economy.
What is happening geopolitically?
Renewed US-Iran tensions and concerns about shipping through the Strait of Hormuz have increased uncertainty about future oil supplies. Reuters reported that the global oil market remained sensitive to attacks on shipping and the risk of further disruption.
For investors, the critical issue is not just whether Brent touches $105 or $110 during one session. It is whether prices remain elevated for long enough to affect inflation, the rupee and corporate costs.
3. Takeaway Three: The Sell-Off Was Broad-Based, With Metals and Realty Under Heavy Pressure
The decline was not confined to a few heavyweight stocks.
On 8 October, all 16 major sectoral indices tracked in Reuters’ market report ended lower. Mid-cap and small-cap indices also fell by more than 2%.
Selected sectoral performance illustrates the extent of the pressure:
| Index | 8 October change |
|---|---|
| Nifty Metal | -3.55% |
| Nifty Realty | -3.16% |
| Nifty Energy | -2.82% |
| Nifty Auto | -2.49% |
| Nifty Pharma | -2.32% |
| Nifty FMCG | -2.02% |
| Nifty IT | -0.08% |
The Nifty IT index was comparatively resilient, but it was still a mixed market rather than a clear sign that technology stocks had become immune to the sell-off.
Why did metals and realty fall so sharply?
Metal stocks: They are sensitive to global growth expectations, commodity prices, industrial demand and changes in global risk appetite. Higher bond yields can also make equities less attractive relative to fixed-income assets.
Realty stocks: Higher borrowing costs can affect home-loan affordability, property demand, developer financing and the valuation investors assign to future earnings.
Auto and consumer stocks: Expensive financing and pressure on household budgets can weigh on demand for discretionary purchases.
These are possible transmission channels, not proof that a single factor caused every sector’s decline.
What about the stocks hitting 52-week lows?
The Nifty’s intraday low of 22,179.90 highlights the severity of the benchmark decline. However, the claim that eight specific companies all reached fresh 52-week lows needs individual stock-price verification before publishing a definitive list.
Investors should also avoid treating a 52-week low as an automatic buying opportunity. A falling share price may reflect temporary panic, but it can also reflect deteriorating earnings expectations or valuation risks.
4. Takeaway Four: Nifty Has Broken 22,300 Support—But a Breakdown Needs Confirmation
The Nifty closed at 22,231.80, below the widely watched 22,300 zone. During the session, it fell to 22,179.90.
That makes the 22,300 area an important reference point for the next few sessions.
Immediate support: 22,180–22,200
The latest session low lies near this zone. A decisive break could expose the psychological 22,000 level.
First resistance: 22,300
The broken support area may act as resistance on a recovery attempt. A single move above it is not enough to confirm a reversal.
Recovery confirmation: sustained trade above 22,300
The case for recovery would strengthen if the index reclaims the level, market breadth improves and selling pressure declines.
Is the “Three Touch Test” a reliable rule?
The idea that repeated tests weaken a support zone is a commonly used technical-analysis concept. But the third test does not automatically cause a breakdown, and the number of tests alone is not a dependable trading signal.
A stronger assessment combines:
- closing price and follow-through
- trading volume
- market breadth
- futures open interest
- FII and DII flows
- global cues, particularly crude oil
Trading scenarios to watch
Scenario A — Gap-down opening: Avoid chasing an already extended decline without a defined stop-loss. Oversold conditions can trigger sharp countertrend bounces.
Scenario B — Pullback toward 22,300: Watch whether the index reclaims the zone or faces selling again. A rejection may support a bearish setup, but confirmation and defined risk are essential.
Scenario C — Recovery above 22,300: Look for sustained price strength, improving breadth and stabilising global cues before treating the move as a potential trend reversal.
These are conditional scenarios, not guaranteed predictions or personalised trade recommendations.
5. Takeaway Five: India VIX Is Rising, While IT Stocks Show Relative Resilience
One of the clearest signs of increased market uncertainty was the rise in India VIX.
On 8 October, India VIX closed at 15.28, up approximately 10.01%. The Nifty IT index, by comparison, declined just 0.08%, making it one of the more resilient sectoral indices that day.
What does India VIX at 15.28 mean?
India VIX measures the market’s expectation of near-term volatility derived from Nifty options prices. A rising VIX generally signals that traders are pricing in greater uncertainty.
However, VIX is not a direct measure of market direction. It can rise during a sell-off and can also remain elevated during a recovery.
For options traders, rising implied volatility can affect premiums, while time decay and changes in the underlying index continue to influence option prices.
Why did IT show relative resilience?
Two potential supports are worth watching:
- Currency effect: A weaker rupee can improve the translated value of overseas revenue for some Indian IT exporters, although hedging and other costs affect the actual benefit.
- Earnings expectations: Investors were watching TCS’s September-quarter results as the earnings season began.
Relative resilience does not automatically make IT stocks safe. Demand for technology services, client spending, margins, valuations and management guidance remain important.
6. The FII Outflow Problem: Domestic Buying Is Not Enough Yet
Foreign portfolio investors sold approximately ₹6,121 crore in the cash market on 8 October, while domestic institutional investors bought approximately ₹4,597 crore.
This imbalance helps explain why domestic institutional support did not prevent the market from falling.
The important question is whether foreign selling slows enough for domestic demand to stabilise prices.
Investors should monitor three signals together:
- FII flows: Is daily selling declining?
- DII flows: Are domestic institutions continuing to absorb supply?
- Price response: Does the market stop making lower lows despite continued selling?
A single day of institutional buying or selling is not enough to establish a lasting trend.
7. What Investors Should Do After the Nifty Breakdown
The temptation after a sharp fall is to buy stocks simply because they are cheaper than they were a week ago. That can be risky if earnings expectations and macroeconomic conditions are also deteriorating.
A more disciplined approach separates long-term investing from short-term trading.
For long-term investors
Review company fundamentals, debt, free cash flow, earnings visibility and valuation. Consider staggered investments only if the original investment thesis remains intact.
For swing traders
Monitor the 22,180–22,200 support zone and the 22,300 recovery level. Wait for price confirmation rather than assuming a reversal from oversold conditions.
For F&O traders
Use defined risk limits and avoid oversized positions. Rising volatility can make option premiums expensive and sudden reversals can hurt both directional trades and short-volatility strategies.
For all investors
Track crude oil, the rupee, US bond yields, RBI commentary and corporate earnings. These factors can matter more than a single technical indicator.
8. Key Market Data: 8 October 2026
| Indicator | Closing data |
|---|---|
| Nifty 50 | 22,231.80 |
| Nifty daily change | -371.25 points (-1.64%) |
| Nifty intraday low | 22,179.90 |
| Sensex | 71,593.24 |
| Sensex daily change | -1,045.46 points (-1.44%) |
| India VIX | 15.28 (+10.01%) |
| Brent crude | Around $104.13/barrel |
| FII/FPI net activity | Approximately ₹6,121 Cr selling |
| DII net activity | Approximately ₹4,597 Cr buying |
| RBI repo rate | 5.50% |
| Key technical zone | 22,180–22,300 |
Sources: Reuters, Financial Express and published market data for 8 October 2026. Figures are rounded where appropriate.
9. Final Verdict: Is This a Market Crash or a Deeper Correction?
The 8 October sell-off was more than a routine decline. The Nifty broke below 22,300, foreign selling remained heavy, crude oil rose above $104, and volatility increased.
But one session alone cannot establish whether the market has entered a prolonged bear phase.
The next direction will depend on whether these pressures persist:
- Crude oil: Does it remain above $100, or retreat meaningfully?
- Foreign flows: Does FII selling moderate?
- Rupee: Does currency weakness intensify imported-inflation risks?
- RBI policy: Does the calibrated-tightening stance lead to further action?
- Corporate earnings: Do results and management guidance support current valuations?
- Technical structure: Can Nifty reclaim 22,300, or does selling continue below 22,200?
The most important takeaway: do not confuse a sharp fall with a guaranteed buying opportunity, or a one-day bounce with a confirmed market bottom.
A recovery becomes more credible when prices stabilise, market breadth improves, volatility cools,s and institutional selling eases.
FAQs
Why did Nifty fall 371 points on 8 October 2026?
The decline followed a combination of rising crude oil prices, the RBI’s hawkish policy shift, foreign investor outflows, a weaker rupee and pressure across global markets.
What was Nifty’s closing level?
Nifty 50 closed at 22,231.80, down 371.25 points or 1.64%.
Did Brent crude close above $108?
The available closing-price data do not support that claim for 8 October. Brent was reported around $104.13 per barrel at settlement, with an intraday price near $105.90.
What does India VIX at 15.28 indicate?
It indicates that options markets were pricing in higher expected near-term volatility. It does not, by itself, predict whether Nifty will rise or fall next.
Is 22,300 still an important Nifty level?
Yes. Nifty closed below 22,300 on 8 October. Traders may now watch 22,300 as a potential resistance area and 22,180–22,200 as the immediate support zone, while recognising that technical levels are estimates rather than guarantees.
Should investors buy stocks after a market crash?
Not solely because prices have fallen. Investors should evaluate fundamentals, valuation, financial strength and risk tolerance. A lower price does not necessarily mean a stock is undervalued.
Disclaimer
This article is for educational and informational purposes only and does not constitute investment or trading advice. Stock markets, futures and options, commodities and currencies involve substantial risk, including loss of capital. Technical levels and market scenarios are illustrative, not guaranteed predictions. Verify live market data before publication or trading, conduct independent research, and consult a SEBI-registered investment adviser where appropriate.
Top 10 SEO Titles
- Nifty Crash Today: Index Falls 371 Points as Crude Oil Surges Above $104
- Indian Stock Market Crash: Why Nifty Fell to 22,231 on October 8, 2026
- Nifty 50 Today: 5 Reasons Behind the Market Crash and FII Selling
- Stock Market News Today: Nifty Plunges, Sensex Loses Over 1,000 Points
- Crude Oil Price Surge: How US-Iran Tensions Are Impacting the Indian Stock Market
- FII Selling Today: Why Foreign Investors Are Exiting Indian Stocks
- Nifty Support Levels After Market Crash: Is 22,000 the Next Target?
- India VIX Jumps 10%: What the Rising Fear Index Means for Investors
- Nifty Crash Explained: Crude Oil, RBI Policy, FII Outflows and 5 Key Takeaways
- Indian Stock Market Outlook 2026: Can Nifty Recover After Breaking 22,300 Support?