

The 18,000 Question: Why Smart Money Is Moving Away From the Indian Market
1. Introduction: India’s Growth Story Versus Market Returns
India continues to attract global attention because of its economic growth, expanding digital infrastructure, manufacturing ambitions, and rising domestic consumption. However, economic growth does not automatically guarantee attractive stock-market returns.
For investors, the more important question is whether current equity valuations adequately compensate for:
- Government bond yields.
- Currency depreciation.
- Corporate earnings growth.
- Global interest rates.
- Geopolitical risks.
- Alternative investment opportunities.
Foreign Portfolio Investors (FPIs) have resumed selling Indian equities in September 2026 after buying shares during July and August. According to reports citing depository data, FPIs withdrew approximately ₹20,974 crore from Indian equities during September up to September 19, while total 2026 outflows reached around ₹2.45 lakh crore. July and August, however, saw inflows of approximately ₹20,200 crore and ₹29,630 crore, respectively.
This data suggests that foreign investors have not necessarily abandoned India permanently. Instead, their allocations are responding to changing valuations, currency movements, crude oil prices, bond yields and global risk conditions.
Important: A possible Nifty 18,000 scenario is a stress-case analysis, not a confirmed target or a prediction that the index will reach that level.
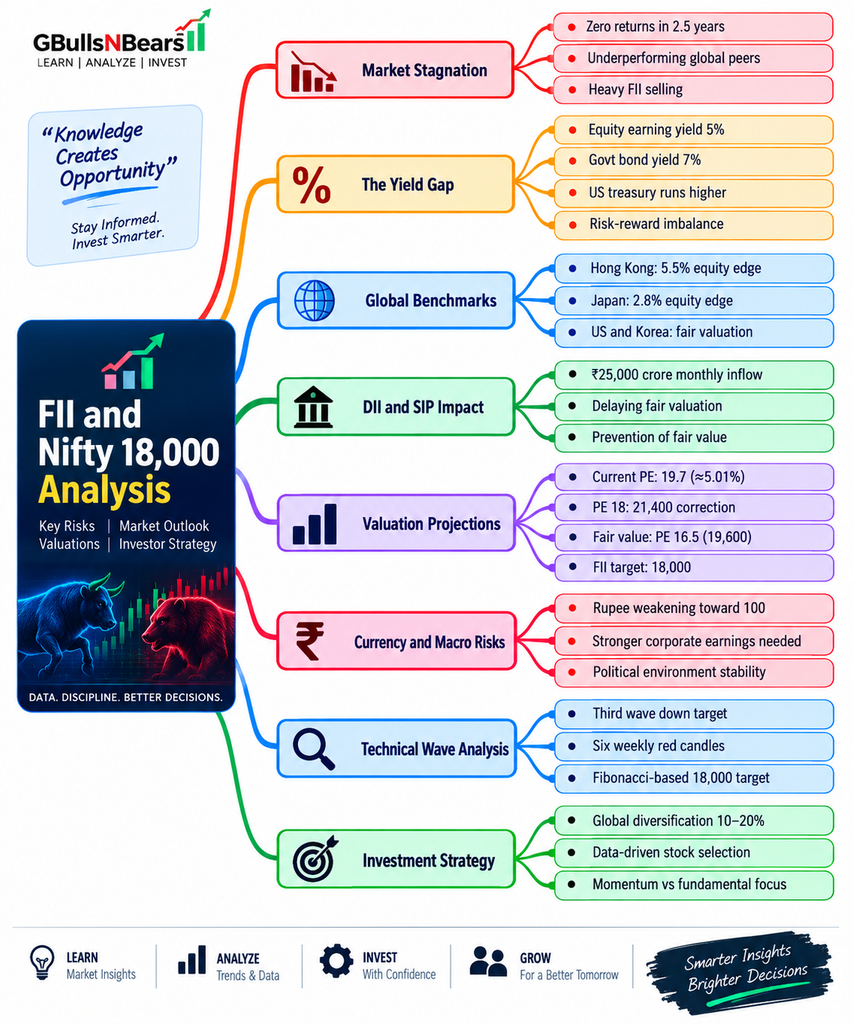
2. The Yield Gap: Why Valuation Matters to Global Investors
One of the most important factors influencing international capital allocation is the relationship between equity earnings yield and government bond yields.
What is earnings yield?
Earnings yield is the inverse of the price-to-earnings ratio:
Earnings Yield=P/E Ratio1×100
For example, if an index trades at a P/E of 19.7:
Earnings Yield=19.71×100≈5.08%
This is not the same as the investor’s guaranteed return. It simply represents the earnings generated relative to the price paid, based on the selected earnings measure.
Illustrative equity-versus-bond comparison
| Metric | Illustrative value |
|---|---|
| Equity P/E assumption | 19.7 |
| Implied earnings yield | Approximately 5.08% |
| Government bond yield assumption | 7% |
| Bond minus earnings yield | Approximately 1.92 percentage points |
If the assumptions above are accurate and comparable, government bonds offer a higher headline yield than the equity earnings yield. However, the comparison must consider earnings growth, taxation, inflation, risk, duration and the fact that equity earnings are not distributed automatically to investors.
CLSA’s India valuation analysis has highlighted the importance of the bond-equity yield spread, with its referenced framework showing the 10-year government bond yield relative to Nifty forward earnings yield. The precise gap changes with market prices, earnings estimates and bond yields.
Why the yield gap matters
When bond yields increase while equity valuations remain elevated, investors may ask:
- Why take higher equity-market risk?
- Is expected earnings growth sufficient to justify the premium?
- Could a cheaper market offer better risk-adjusted returns?
- Will currency depreciation reduce returns in dollar terms?
These questions can influence FPI allocations even when India’s long-term economic growth story remains intact.
3. FII Selling: Capital Rotation or Loss of Confidence?
The phrase “smart money is leaving India” is attention-grabbing, but it oversimplifies the available evidence.
Recent reports have linked September’s foreign selling to several factors:
- Higher crude oil prices.
- Rising US bond yields.
- A stronger dollar.
- Rupee depreciation.
- India’s valuation premium compared with other emerging markets.
- Geopolitical uncertainty.
Moneycontrol reported that FPIs sold nearly ₹21,000 crore in September after investing during the previous two months. Analysts cited in the report described the activity as selective rather than conclusive evidence of a complete exit from India.
FPI flow data
₹-40Kcrore₹-20Kcrore₹0crore₹20Kcrore₹40Kcrore
July 2026
August 2026
September 2026*
*September figure represents the period reported through approximately September 19–20, 2026. Figures are rounded and should not be interpreted as a complete month-end total. Source: reports citing CDSL/NSDL data.
The chart illustrates a change in monthly direction, but it does not prove that every foreign investor has the same outlook. Capital may move between:
- Indian equities and Indian bonds.
- India and other emerging markets.
- Secondary-market shares and IPOs.
- Equity sectors with different earnings and currency exposure.
The key issue is not only how much money leaves, but where it goes and why.
4. The Currency Factor: Why the Rupee Matters to Foreign Investors
Foreign investors evaluate returns in their own base currency, often the US dollar. Therefore, equity returns in rupees can differ substantially from returns after currency conversion.
Simplified example
Assume:
- Indian equity return: +5%
- Rupee depreciation against the dollar: 8%
- Investment period: one year
A simplified dollar return is:
(1.05×0.92)−1=−3.4%
The investor could experience a negative return in dollar terms even though the Indian equity investment gained 5% in rupees.
This example excludes transaction costs, taxes, hedging and compounding differences. It demonstrates why currency risk can change the attractiveness of Indian equities for global investors.
Reports in September 2026 linked the rupee’s weakness, higher crude prices and US bond yields to renewed FPI selling pressure.
5. The US Market Versus India: Is Global Capital Searching for Value?
Investors should avoid assuming that foreign capital moves only toward the highest-growth economy. Institutional portfolios also consider:
- Earnings revisions.
- Valuation multiples.
- Sector composition.
- Currency trends.
- Market liquidity.
- Interest-rate expectations.
- Exposure to structural themes such as AI, semiconductors and technology infrastructure.
A market with a higher P/E ratio is not automatically overvalued, and a market with a lower P/E ratio is not automatically cheap. The quality and sustainability of earnings are equally important.
A practical comparison framework
| Factor | Questions investors should ask |
|---|---|
| Valuation | What earnings assumptions are already priced in? |
| Earnings growth | Are profits expected to grow faster than valuations? |
| Currency | Could depreciation reduce foreign-currency returns? |
| Interest rates | Are bonds becoming more attractive? |
| Sector mix | Does the index benefit from global growth themes? |
| Risk | How exposed is the market to oil, trade and geopolitics? |
Reuters reported that foreign investors were directing capital toward other Asian markets offering different valuation and sector opportunities, while also noting that India retained support from domestic investors and economic growth expectations.
6. The SIP Support System: Strength or Delayed Price Discovery?
Monthly Systematic Investment Plans (SIPs) have become an important source of domestic market liquidity. Domestic institutional investors can help reduce the immediate impact of foreign selling, particularly during periods of global uncertainty.
However, strong domestic inflows do not guarantee that every stock is fairly valued.
Three possible effects
1. Market support
Consistent domestic inflows may absorb part of the selling pressure from foreign investors.
2. Valuation persistence
If investors continue buying regardless of valuation, expensive stocks may remain expensive for longer.
3. Delayed correction
A correction can be postponed, but postponement does not eliminate the possibility of future repricing.
The idea that domestic flows create an “artificial floor” should be treated as an analytical hypothesis rather than a fact. SIP investments can support prices, but earnings, liquidity, investor expectations and macroeconomic conditions continue to influence market valuation.
7. Can Nifty Reach 18,000? A Scenario-Based Framework
A Nifty 18,000 level would represent a substantial decline from the market levels discussed in the article. However, a precise target cannot be justified solely through a Fibonacci projection, a specific P/E assumption, or a few technical indicators.
Instead, investors can evaluate different scenarios.
Scenario framework
Scenario A: Earnings-led correction
Moderate risk
- Earnings growth slows.
- Valuations contract gradually.
- Domestic flows provide some support.
- Market correction remains sector-specific.Scenario B: Global risk-offevent. Higher risk
- US bond yields rise sharply.
- Crude oil remains elevated.
- Rupee weakness increases.
- FPI selling intensifies.
- Equity multiples contract more rapidly. Scenario C: Severe valuation reset. Stress case
- Corporate earnings disappoint.
- Global liquidity tightens.
- Domestic and foreign investors reduce risk.
- A deeper index correction becomes possible.
These scenarios do not establish that Nifty will reach 18,000. They help investors understand the conditions that could cause a larger market decline.
Levels mentioned in the thesis
The article identifies 21,400, 19,600, and 18,000 as potential valuation or technical reference points. These levels should be recalculated using:
- Current index earnings.
- Forward EPS estimates.
- Actual support and resistance data.
- Market breadth.
- Volume and derivatives positioning.
- Changes in interest rates and currency.
Without updated calculations, these should be considered hypothetical analytical levels, not confirmed fair-value targets.
8. What Could Trigger a Deeper Market Correction?
A larger correction would generally require a combination of negative developments rather than one isolated indicator.
Red flag 1: Rising bond yields
Higher domestic or international bond yields can increase the discount rate used to value equities. They may also encourage some investors to shift toward fixed-income instruments.
Red flag 2: Persistent FPI selling
A prolonged period of foreign selling may put pressure on large-cap stocks, the rupee and market sentiment. However, selling data must be assessed alongside primary-market investments and sector-level allocation.
Red flag 3: Earnings downgrades
Valuations can remain elevated if earnings grow strongly. Conversely, a fall in expected earnings can increase the effective P/E ratio even when stock prices do not rise.
Red flag 4: Higher crude oil prices
India is a major oil importer. Sustained increases in crude prices can affect:
- Import costs.
- Inflation.
- The current account.
- Corporate margins.
- Consumer purchasing power.
- Currency stability.
Red flag 5: Weak market breadth
When a small number of large companies support an index while many stocks decline, investors should monitor:
- Advance-decline ratio.
- New highs versus new lows.
- Sector participation.
- Trading volume.
- Relative strength of index constituents.
A weak breadth reading alone does not guarantee a crash, but it can provide context for assessing market participation.
9. Investment Strategy: What Should Investors Monitor?
Instead of focusing exclusively on a single index target, investors can build a structured monitoring system.
Valuation checklist
- Nifty forward P/E compared with its historical range.
- Earnings yield compared with the 10-year government bond yield.
- Earnings upgrades and downgrades.
- Sector-level valuation differences.
- Corporate profit margins.
Macro checklist
- US 10-year Treasury yield.
- Indian 10-year government bond yield.
- USD/INR movement.
- Brent crude oil prices.
- Foreign portfolio flows.
- RBI policy and liquidity conditions.
Technical checklist
- Nifty trend relative to major moving averages.
- Market breadth.
- Volume during breakdowns.
- Futures open interest and positioning.
- Support and resistance confirmation.
- Volatility and option pricing.
Portfolio risk management
Investors may consider:
- Avoiding excessive concentration in a single sector.
- Maintaining an emergency liquidity reserve.
- Reviewing position sizes after significant price increases.
- Separating long-term investments from short-term trading capital.
- Using predefined risk limits instead of emotional decisions.
- Avoiding leverage when market volatility is elevated.
10. Conclusion: Is India Expensive, or Is the Market in Transition?
The current FPI selling cycle highlights a key reality: India’s economic growth story and its stock-market valuation are two different questions.
Foreign investors may reduce exposure when they see a combination of:
- Expensive valuations.
- Higher global bond yields.
- Rupee depreciation.
- Elevated crude oil prices.
- More attractive opportunities in other markets.
At the same time, domestic SIP flows, economic expansion and long-term corporate earnings can provide support. Neither foreign selling nor domestic buying alone determines the future direction of the Nifty.
The 18,000 scenario should therefore be viewed as a stress-test framework, not a guaranteed market destination. Investors should track valuation, earnings, capital flows and macroeconomic data before making decisions.
The real question is not whether Nifty will reach 18,000. The real question is whether your portfolio can withstand a significant correction without forcing you into an emotional decision.
Frequently Asked Questions
1. Why are FIIs selling Indian stocks in 2026?
Reported factors include elevated crude oil prices, higher US bond yields, rupee weakness and India’s valuation premium relative to some other markets. FPI flows can change quickly, so monthly selling should not automatically be interpreted as a permanent exit.
2. Does a high P/E ratio mean the Nifty is overvalued?
Not necessarily. A high P/E can be justified by strong future earnings growth, but investors should compare the valuation with earnings expectations, interest rates and historical ranges.
3. Is Nifty 18,000 a confirmed target?
No. It is a hypothetical downside scenario in this analysis. Reaching that level would depend on market valuation, earnings, liquidity, global conditions and technical developments.
4. How does rupee depreciation affect foreign investors?
Rupee depreciation can reduce returns after conversion into the investor’s home currency, even if the Indian stock investment generates a positive rupee return.
5. Should investors stop SIP investments during a correction?
The appropriate approach depends on financial goals, time horizon, risk tolerance and asset allocation. Investors should avoid making decisions solely based on a market prediction.
Disclaimer
This article is intended for educational and informational purposes only. It is not financial, investment, tax or legal advice. The market levels, scenarios and calculations are illustrative and may change as new data becomes available. Market investments involve risks, including capital loss, volatility and currency-related risks. Investors should verify information through reliable sources and consult a qualified financial professional before making investment decisions.
🔥 Top 10 SEO Titles for Your Article
1. Nifty 18,000 Target: Why FIIs Are Selling Indian Stocks and What Investors Should Know
2. Why FIIs Are Exiting India in 2026: Nifty 18,000, Yield Gap and Market Risks Explained
3. Nifty 18,000 Crash Warning? FII Selling, High Valuations and the Indian Stock Market Outlook
4. Indian Stock Market Outlook 2026: Can Nifty Fall to 18,000? Key Risks Investors Must Watch
5. FII Selling in India: The Real Reason Behind Nifty’s Weakness and the 18,000 Market Prediction
6. Nifty Valuation Crisis: Yield Gap, Rupee Weakness and Why Foreign Investors Are Moving Away
7. Is Nifty 18,000 Possible? Understanding FII Outflows, Bond Yields and Indian Market Valuations
8. India Stock Market Warning: FII Capital Rotation, SIP Buying and the Risk of a Major Correction
9. Nifty 50 at Risk? FII Selling, Earnings Yield and the Road to Fair Value Explained
10. The Nifty 18,000 Question: Why Global Investors Are Rethinking Indian Stock Market Valuations