
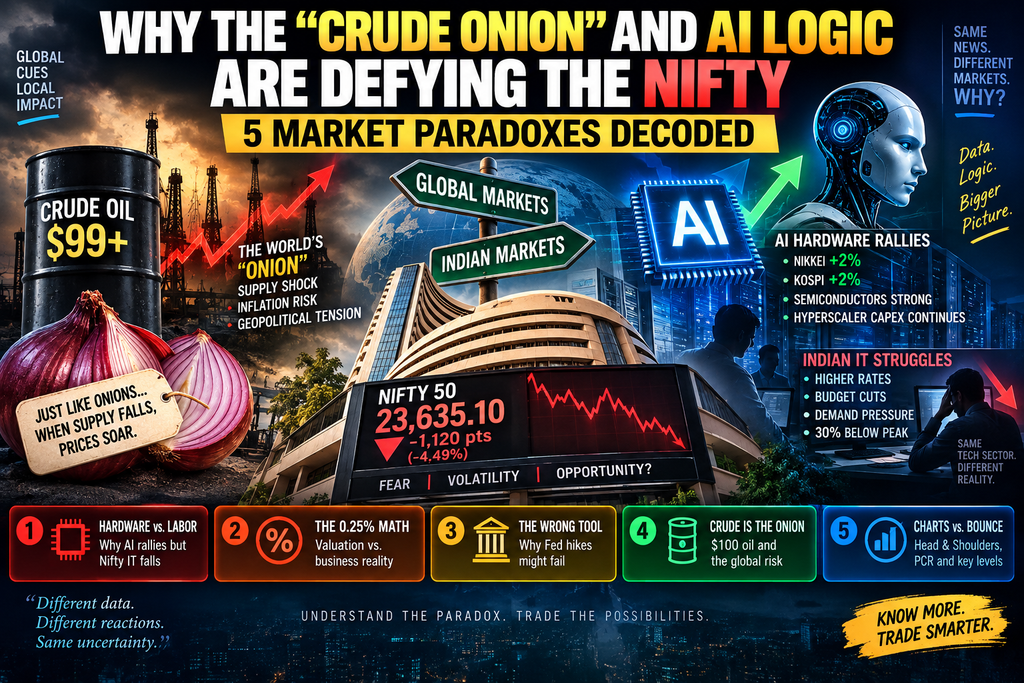
The global market is currently behaving as if it has forgotten its own rulebook.
On one side, India’s Nifty 50 is under pressure, falling to 23,635.10 on September 8, while the Sensex lost more than 555 points. On the other side, semiconductor-heavy Asian markets have continued to attract buyers. South Korea’s KOSPI, for example, was up nearly 2% on September 8, led by Samsung Electronics and SK Hynix.
The contradiction becomes even stranger.
The latest US payroll report showed 162,000 new jobs in August, while unemployment remained at 4.1%. Strong employment normally sounds positive for the economy—but markets interpreted it as another reason for the Federal Reserve to remain hawkish.
At the same time, Brent crude has moved toward the psychologically important $100-per-barrel level, with geopolitical tensions around Iran and the Strait of Hormuz adding another inflation shock. Brent reached approximately $99.46 on September 8.
This creates five fascinating market paradoxes.
Paradox #1: Why AI Hardware Is Rallying While Indian IT Is Struggling
The first paradox is the biggest one:
Why are semiconductor stocks benefiting from AI optimism while Indian IT companies are suffering from the same global macro environment?
The answer lies in the economic mechanism of revenue.
AI hardware companies are positioned around a structural investment cycle involving:
- GPUs
- memory chips
- semiconductor equipment
- data centers
- networking
- AI infrastructure
Indian IT services companies operate differently.
Their revenue is heavily connected to:
- corporate technology budgets
- consulting
- software implementation
- maintenance
- outsourcing
- discretionary IT spending
Therefore, a higher cost of money can affect the two businesses differently.
AI hardware story:
AI demand → infrastructure spending → chip demand → higher semiconductor earnings expectations
Traditional IT story:
Higher rates → tighter corporate budgets → discretionary spending pressure → slower IT services demand
The market is already showing this divergence.
On September 7, Nifty IT fell more than 1%, with Infosys, Tech Mahindra and HCLTech among the pressured names as stronger US employment data increased expectations of a possible Fed hike.
The contrast is even more visible in individual stocks. TCS was roughly 32% below its 52-week high on September 8, while Infosys was around 37% below its 52-week high.
Meanwhile, Korean semiconductor stocks were moving in the opposite direction.
Samsung Electronics gained roughly 2.6% and SK Hynix nearly 4% during Tuesday trading, helping push the KOSPI toward a three-week high.
The key lesson:
“Technology” is not one trade anymore.
AI infrastructure, semiconductor memory and traditional IT services are increasingly responding to different economic forces.
Paradox #2: The 0.25% Rate Move Can Change Valuations Without Changing the Business
The market’s obsession with a 25-basis-point rate move can sometimes look irrational.
A company doesn’t suddenly become 10% worse because the Fed moves rates by 0.25%.
But its valuation mathematics can change immediately.
This is because stocks are valued by discounting future cash flows.
Imagine a company expected to generate ₹100 ten years from now.
At a lower discount rate, that future ₹100 is worth more today.
At a higher discount rate, it is worth less.
That’s particularly important for companies whose largest earnings are expected far into the future.
But there is an important correction to the original argument:
A 25-basis-point hike does not automatically turn a $100 stock into a $90 stock.
There is no universal formula saying:
+0.25% rates = -10% stock price.
The impact depends on:
- duration of expected cash flows
- earnings growth
- valuation multiple
- risk premium
- debt levels
- market positioning
- starting valuation
So the real mechanism is:
Higher risk-free rate → higher discount rate → lower present value of distant cash flows → potential multiple compression
That is why expensive growth stocks can be extremely sensitive to Treasury yields.
Paradox #3: The Fed Is Fighting Inflation With a Tool That Cannot Produce More Oil
This is where the “Nashik Onion” analogy becomes useful.
Imagine heavy rain destroys the onion crop in Nashik.
The price jumps:
₹30 → ₹120
What happens if the RBI raises interest rates?
Will farmers suddenly produce more onions?
No.
The problem is supply.
The same logic applies to oil.
If geopolitical disruption removes barrels from the global market, higher interest rates cannot manufacture additional crude oil.
Yet central banks still have to respond because supply shocks can create second-round inflation.
That is the Fed’s dilemma.
The US Consumer Is Already Saving Less Than Normal
The original article’s 2.6% savings-rate figure needs an update.
The US personal saving rate fell to 2.6% in June 2026, but the latest July data showed it recovering to 3.0%.
That is still relatively low compared with the enormous savings accumulated during the pandemic period.
So the better argument isn’t:
“Americans have only 2.6% savings.”
It is:
“US households have a relatively thin savings buffer compared with the pandemic era, while consumption remains an important support for economic growth.”
That makes monetary policy more complicated.
If the Fed tightens too aggressively:
Rates ↑ → credit becomes expensive → consumption slows → investment slows → unemployment eventually rises
But if it doesn’t respond to inflation:
Oil ↑ → inflation ↑ → inflation expectations ↑ → real incomes get squeezed
This is the central-bank paradox.
Paradox #4: Crude Oil Has Become the World’s “Onion”
This is the most important macro variable for India right now.
Brent crude has climbed close to $100, with the latest move driven by attacks on Saudi energy facilities, Iranian threats and disruptions around the Strait of Hormuz.
Reuters reported that only seven commodity vessels passed through the Strait of Hormuz on Monday, compared with eight the previous day, according to Kpler data.
That matters because Hormuz is one of the world’s most important energy chokepoints.
The market is therefore asking a simple question:
Is $100 oil the ceiling—or only the beginning?
Why $100 Oil Is So Dangerous for India
India is particularly sensitive to crude because of its dependence on imported energy.
The transmission mechanism is straightforward:
Crude ↑
↓
Import bill ↑
↓
Current-account pressure ↑
↓
Rupee pressure ↑
↓
Imported inflation ↑
↓
RBI flexibility ↓
↓
Equity valuations ↓
That is why oil is more important to the Indian market than many individual US macroeconomic releases.
The $90 vs $100 vs $120 Crude Map
🟢 Brent below $90
Relatively comfortable environment.
- Inflation pressure eases
- Rupee gets breathing room
- RBI has greater flexibility
- Nifty valuations can stabilize
🟡 Brent $90-$100
The danger zone.
- Inflation expectations rise
- RBI becomes cautious
- FII risk appetite can weaken
- Energy-sensitive sectors become volatile
🔴 Brent above $120
This would represent a completely different macro regime.
It could produce:
- stronger inflation
- weaker emerging-market currencies
- higher bond yields
- lower equity multiples
- increased probability of global monetary tightening
That is why investors should monitor Brent crude almost as closely as Nifty itself.
The “Crowded Oil Trade” Is More Complicated Than It Looks
Another important correction concerns crude positioning.
The claim that money managers simply hold 37,000 net-long Brent contracts doesn’t capture the current positioning cleanly.
The latest CFTC data for September 1 shows a much more complicated structure across managed money, commercial hedgers and other categories.
One data aggregation based on the CFTC report shows large speculators were actually net short Brent by roughly 39,397 contracts, while managed money itself was net long around 5,307 contracts.
That distinction matters.
It means the crude market isn’t simply:
“Everyone is bullish oil.”
Instead, it may be closer to:
“The physical market is tightening while speculative positioning remains divided.”
And that can make oil particularly vulnerable to sudden price spikes.
Paradox #5: Bearish Chart, Oversold Options Market
Now we come to Nifty itself.
The technical picture is increasingly important because fundamentals are already negative enough to create fear.
On September 7, Nifty closed at 23,779.15, a six-week low. On September 8, it fell further to 23,635.10.
The 23,800 zone has therefore become an important short-term reference point.
Market commentary on September 8 suggested that Nifty needs to reclaim 23,800 for bullish momentum to improve.
But derivatives data tells another story.
The Nifty PCR based on open interest was around 0.67 on September 8, while volume PCR was around 1.04.
That is an important distinction.
A low OI PCR generally indicates relatively heavier call open interest than put open interest.
But:
Low PCR ≠ guaranteed bottom.
It can indicate:
- bearish positioning
- call writing
- resistance overhead
- crowded expectations
It can also contribute to a short-covering rally if the market suddenly moves higher.
Therefore, the PCR should be treated as a positioning indicator, not a crystal ball.
The Nifty Technical Map
The immediate structure now looks something like this:
Resistance
23,800
If Nifty reclaims and sustains above this area, short-term sentiment could improve.
Next upside zone
24,000
This is both a psychological and technical reference point.
First major support
23,600
The September 8 close itself sits almost exactly around this area.
Next downside zone
23,330
A sustained break could open the door to deeper correction.
Psychological support
23,000
This becomes the bigger defensive line if global macro pressure accelerates.
The important point is that these are scenario levels, not guaranteed targets.
The FII Problem: Foreign Investors Are Still the Wild Card
The Indian market is also facing pressure from foreign capital flows.
Reuters reported that Nifty had already fallen around 2.7% over the preceding month by September 7, while IT stocks were among the major sources of weakness.
The problem becomes worse when three variables move together:
US yields ↑
Oil ↑
Dollar ↑
That combination can make emerging markets relatively less attractive.
For India, the risk is amplified because foreign investors can simultaneously sell equities and seek dollar exposure.
Why AI Is Still Winning the Global Capital Race
Here is the strangest part of the current market.
The same macro environment that is hurting Indian IT is not necessarily destroying AI enthusiasm.
Why?
Because the AI investment thesis is increasingly being treated as an infrastructure cycle, rather than merely a software cycle.
The market is betting that:
- AI models become more capable
- inference demand rises
- data-center capacity expands
- memory demand grows
- networking requirements increase
- hyperscaler capital expenditure remains strong
That is why semiconductor markets can rally even while higher interest rates threaten traditional technology spending.
The market isn’t necessarily saying:
“Higher rates are good for technology.”
It is saying:
“Some technology spending has become strategic enough that companies may continue investing despite higher financing costs.”
That’s a very different proposition.
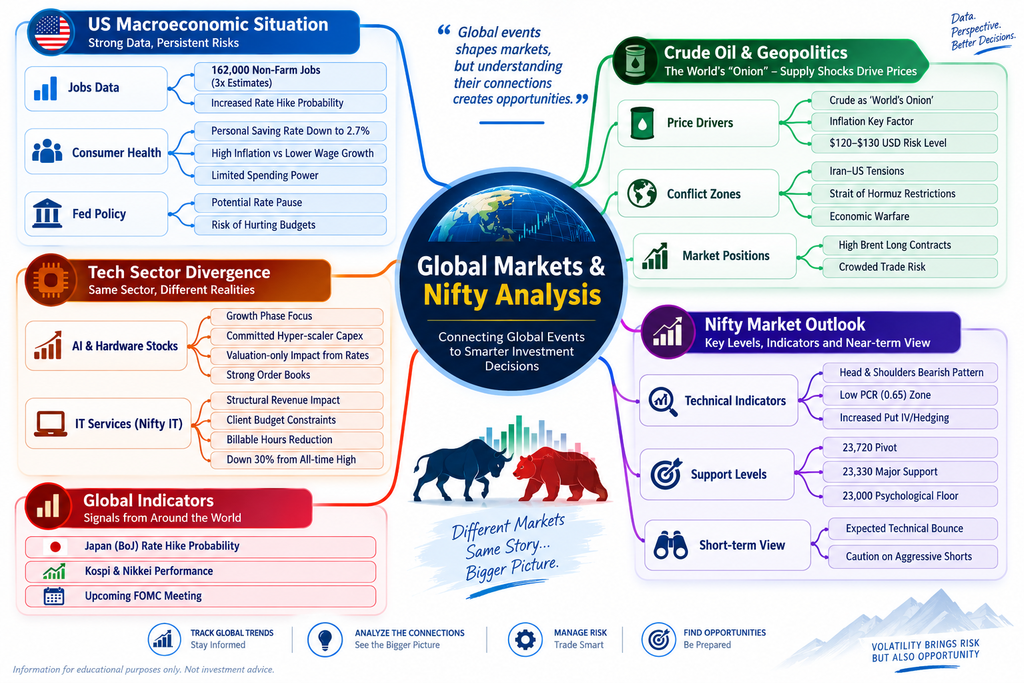
The Real Paradox: Good Economic Data Can Be Bad for Stocks
The August US payroll report provides the perfect example.
162,000 jobs
Sounds bullish.
4.1% unemployment
Sounds bullish.
Strong labor market
Sounds bullish.
But then:
Strong jobs → less urgency for Fed easing → higher rate expectations → higher Treasury yields → lower equity valuations
Therefore:
Good economic data can become bad stock-market news.
That is the strange world investors are currently navigating.
The Federal Reserve is effectively trying to slow the economy enough to control inflation without slowing it so much that unemployment explodes.
The Next Three Data Points Could Decide the Narrative
The market now has several major catalysts.
September 10 — US PPI
Producer-price inflation can provide clues about pipeline price pressures.
September 11 — US CPI
This is the bigger event.
The BLS has scheduled August CPI for September 11 at 8:30 a.m. ET.
September 15-16 — Federal Reserve Meeting
This will determine whether the Fed changes policy and, more importantly, how it communicates the future path of rates.
At the same time, markets are watching the Bank of Japan’s September 17-18 meeting, with expectations for a possible 25-basis-point hike contributing to yen strength and carry-trade concerns.
Three Scenarios for Nifty
🟢 Scenario 1: Oil Falls + CPI Cools
This is the bullish combination.
Brent ↓
US CPI ↓
Treasury yields ↓
Fed expectations soften
Nifty ↑
In this scenario, 23,800 could become the first important level to reclaim, followed by 24,000.
🟡 Scenario 2: Oil Stays Around $95-$100
This is the most uncomfortable middle ground.
The RBI and Fed don’t receive enough relief to become aggressively dovish.
Markets remain volatile.
Nifty could oscillate between:
23,600 ↔ 24,000
with sharp intraday moves.
🔴 Scenario 3: Oil Breaks $100, and Inflation Accelerates
This is the danger scenario.
Oil ↑
Inflation ↑
Treasury yields ↑
Dollar ↑
FII selling ↑
Nifty ↓
If 23,600 fails decisively, the market could begin testing the 23,330 zone, with 23,000 becoming the major psychological support.
The Bigger Picture: Don’t Trade the Headline, Trade the Transmission Mechanism
This is perhaps the biggest lesson from the current market.
Don’t simply read:
“US jobs strong.”
Instead ask:
What does that do to Fed expectations?
Then:
What happens to Treasury yields?
Then:
What happens to the dollar?
Then:
What happens to FII flows?
And finally:
What happens to Nifty?
The same applies to crude.
Don’t simply read:
“Oil hits $100.”
Ask:
Does the move persist?
If it does:
Inflation → RBI → rupee → bonds → equities
That is the transmission mechanism.
Conclusion: The “Crude Onion” Is the Market’s Real Core Problem
The current market isn’t simply an AI bubble, a Fed story,y or an Iran story.
It is a collision of multiple forces:
AI demand
supports semiconductor and infrastructure stocks.
Strong US employment
raises the possibility of tighter monetary policy.
Higher Treasury yields
pressure high-duration valuations.
Crude near $100
raises global inflation risks.
Rising geopolitical tensions
increase the probability of further energy disruptions.
Weak Indian IT
reflects pressure on corporate technology budgets.
Low Nifty PCR
shows heavy positioning but does not guarantee a bottom.
And underneath everything sits one variable:
The price of money.
If crude remains contained below $100, central banks may still find a path toward eventual easing.
If oil moves toward $120-$130, the entire equation changes.
That would force investors to reassess:
Fed policy.
RBI policy.
Bond yields.
Rupee.
FII flows.
Nifty valuations.
And suddenly the “Crude Onion” becomes much bigger than an oil-market story.
It becomes a global monetary-policy story.
The key question for investors is therefore not simply:
“Will Nifty bounce?”
It is:
“Can crude remain controlled long enough for central banks to avoid another policy shock?”
Because if the answer is yes, the current Nifty correction could remain a valuation reset.
If the answer is no, 23,600 may be only the beginning of the next macro repricing.
Disclaimer
This article is for educational and informational purposes only and should not be considered financial, investment, trading, tax, or legal advice. The market data, statistics, forecasts, technical levels, and opinions presented in this article are based on publicly available information and may change without notice.
The discussion of Nifty 50, crude oil, AI stocks, Nifty IT, US Treasury yields, Federal Reserve policy, RBI policy, FII/DII flows, PCR, currencies, and geopolitical developments is intended to explain market dynamics and should not be interpreted as a recommendation to buy, sell, or hold any stock, index, derivative, cryptocurrency, commodity, or other financial instrument.
Financial markets are highly volatile and involve substantial risk. Past performance does not guarantee future results. Technical support and resistance levels mentioned in this article are illustrative and should not be treated as guaranteed price targets.
Readers should conduct their own research and consider their financial objectives, risk tolerance, and investment horizon before making any investment decision. Where appropriate, consult a SEBI-registered investment adviser or other qualified financial professional.
The author and publisher assume no responsibility for any financial loss or damage resulting from decisions made based on the information, analysis, or opinions contained in this article.
Disclaimer
This article is for educational and informational purposes only and should not be considered financial, investment, trading, tax, or legal advice. The market data, statistics, forecasts, technical levels, and opinions presented in this article are based on publicly available information and may change without notice.
The discussion of Nifty 50, crude oil, AI stocks, Nifty IT, US Treasury yields, Federal Reserve policy, RBI policy, FII/DII flows, PCR, currencies, and geopolitical developments is intended to explain market dynamics and should not be interpreted as a recommendation to buy, sell, or hold any stock, index, derivative, cryptocurrency, commodity, or other financial instrument.
Financial markets are highly volatile and involve substantial risk. Past performance does not guarantee future results. Technical support and resistance levels mentioned in this article are illustrative and should not be treated as guaranteed price targets.
Readers should conduct their own research and consider their financial objectives, risk tolerance, and investment horizon before making any investment decision. Where appropriate, consult a SEBI-registered investment adviser or other qualified financial professional.
The author and publisher assume no responsibility for any financial loss or damage resulting from decisions made based on the information, analysis, or opinions contained in this article.
Top 10:
- Crude Oil, AI & Nifty: 5 Market Paradoxes Every Investor Must Understand
- Why Nifty Is Falling While AI Stocks Rally: 5 Market Paradoxes Explained
- Nifty 2026: Crude Oil, AI, Fed Rates and 5 Market Paradoxes You Can’t Ignore
- Crude Oil Near $100: Why Nifty Is Under Pressure While AI Stocks Rally
- Nifty Market Outlook 2026: 5 Hidden Signals Behind the Current Market Shakeup
- AI vs Nifty IT: Why Chip Stocks Are Rallying While Indian IT Stocks Struggle
- Why $100 Oil Could Change Nifty’s Fate: 5 Market Risks Investors Should Watch
- Nifty at 23,635: Crude Oil, Fed Rates & AI Create a Market Paradox
- US Jobs Shock, $100 Oil & Nifty: 5 Forces Driving the Indian Stock Market
- Nifty’s Next Big Move: Crude Oil, AI, Fed Policy and the Hidden Market Signals