
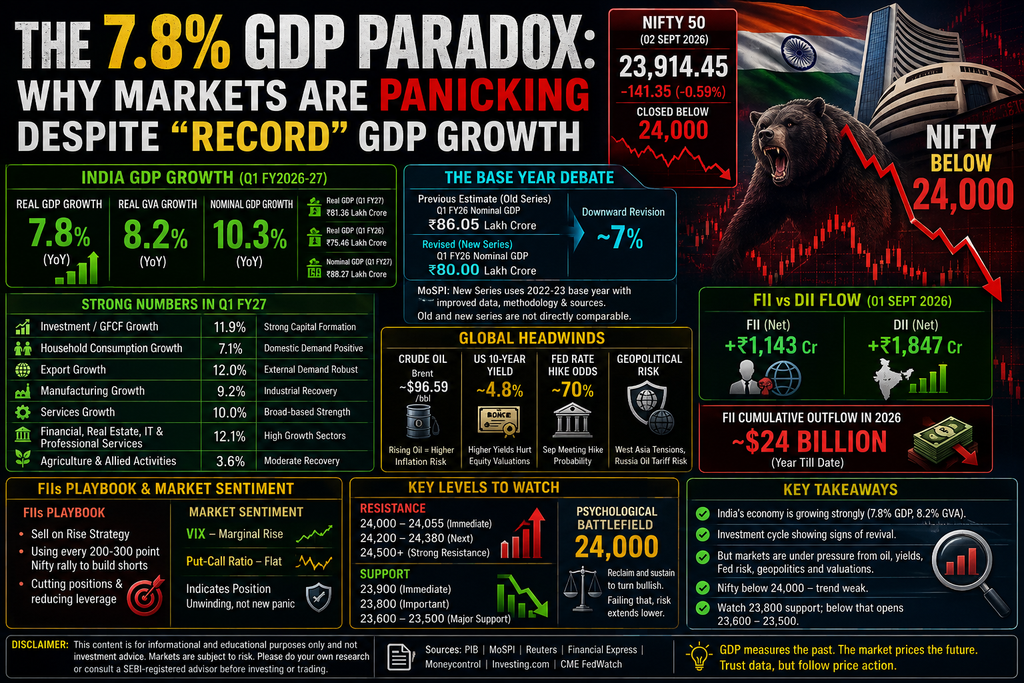
India GDP Growth at 7.8%, But Nifty Falls Below 24,000
India’s economy has delivered a powerful growth surprise, but the stock market is telling a very different story.
Real GDP grew 7.8% year-on-year in Q1 FY2026-27 (April–June 2026), beating the Reserve Bank of India’s earlier 7% estimate and the market consensus of around 7.1%. Real GVA growth was even stronger at 8.2%.
Yet the Nifty 50 moved in the opposite direction.
On September 2, 2026, Nifty fell 141.35 points, or 0.59%, to 23,914.45, closing below the psychologically important 24,000 level. The Sensex also declined 373.93 points to 76,570.35.
So the obvious question is:
If India’s economy is growing at 7.8%, why is the stock market under pressure?
The answer is that GDP and stock prices measure two very different things.
GDP measures economic activity.
The stock market prices future earnings, interest rates, liquidity, risk and valuations.
And right now, those variables are sending a much more cautious signal.
1. The 7.8% GDP Number Is Real — But the Base-Year Debate Matters
The biggest controversy surrounding the latest GDP number is the revision of India’s national accounts.
India moved its GDP base year from 2011-12 to 2022-23 earlier this year. MoSPI said the new series incorporates newer data sources, updated classifications and methodological improvements.
Under the latest series:
- Q1 FY2026-27 real GDP: ₹81.36 lakh crore
- Q1 FY2025-26 real GDP: ₹75.46 lakh crore
- Real GDP growth: 7.8%
- Q1 FY2026-27 nominal GDP: ₹88.27 lakh crore
- Nominal GDP growth: 10.3%
- Real GVA growth: 8.2%
There is, however, an important statistical issue.
The previous Q1 FY2025-26 current-price GDP estimate was initially ₹86.05 lakh crore under the old series. After the base-year change and subsequent data revisions, it became approximately ₹80.00 lakh crore.
This has led to claims that the lower base mechanically inflated the latest growth rate.
But there is a catch
MoSPI has rejected that interpretation.
The ministry explained that the ₹86.05 lakh crore figure came from the superseded 2011-12 series and cannot be directly compared with the current Q1 FY2026-27 estimate under the new 2022-23 series.
The revised Q1 FY2025-26 figure went through multiple stages:
₹86.05 lakh crore → ₹80.32 lakh crore → ₹80.44 lakh crore → ₹80.00 lakh crore
according to successive revisions and updated data.
Therefore, the strongest way to describe the controversy is:
The GDP methodology has changed, but that does not by itself prove that the 7.8% growth rate is artificial.
That distinction is crucial for an accurate financial article.
2. The “Missing Growth” Argument Is More Complicated Than It Looks
Critics often argue that 7.8% GDP growth should automatically produce stronger employment, consumption, and private investment.
But the latest data actually shows several areas of strength.
According to government data:
- Investment/GFCF growth: 11.9%
- Household consumption/PFCE growth: 7.1%
- Exports growth: 12.0%
- Real GVA growth: 8.2%
- Manufacturing growth: 9.2%
- Services growth: 10.0%
- Financial, real estate, IT and professional services: 12.1%
- Agriculture and allied activities: 3.6%
That means the latest GDP report does not support a simple “there is no investment” narrative.
In fact, gross fixed capital formation increased to 34.3% of GDP, compared with 31.4% a year earlier. Reuters also reported that private-sector capital investment is showing signs of revival.
So the better question is not:
“Is India really growing?”
The evidence says yes.
The more important question for investors is:
“Is this growth strong enough to justify current equity valuations?”
That is where the stock-market debate begins.
3. The Real Problem: Crude Oil Is Changing the Inflation Equation
One of the biggest reasons the market ignored the positive GDP surprise is crude oil.
On September 2, Brent crude was around $96.59 per barrel, while WTI was around $91.58. Rising oil prices were linked to escalating tensions in West Asia and renewed concerns about supply disruptions.
For India, expensive crude is particularly important because the country is one of the world’s largest oil importers.
The chain reaction can look like this:
Crude ↑
↓
Import bill ↑
↓
Inflation risk ↑
↓
Rupee pressure ↑
↓
Interest-rate expectations ↑
↓
Equity valuations ↓
This is why a strong GDP number cannot necessarily trigger a stock-market rally when oil prices are simultaneously surging.
4. The Fed Risk Has Suddenly Become More Important
Another major change is the global interest-rate outlook.
As inflation concerns returned, expectations for a September Federal Reserve rate hike increased sharply.
By September 2, market pricing showed roughly a 70% probability of a Fed rate hike at the upcoming meeting, according to CME-based market expectations reported by financial media.
The U.S. 10-year Treasury yield also climbed toward 4.8%.
This creates a valuation problem for emerging markets.
When safe U.S. government bonds offer higher yields, investors can demand a greater risk premium before holding equities in countries such as India.
5. DCF Valuations Explain Why Higher Bond Yields Hurt Stocks
There is another technical reason why global bond yields matter.
Institutional investors frequently use discounted cash-flow models to value companies.
In simplified terms:
Higher discount rate → Lower present value of future earnings
This particularly affects companies whose expected profits lie far in the future.
Therefore, rising bond yields can put pressure on:
- Technology stocks
- AI-related companies
- High-growth companies
- Expensive midcaps
- Expensive smallcaps
- Long-duration growth stocks
The market can therefore sell growth stocks even when the underlying economy is growing strongly.
6. FII Selling Is a Warning — But the Latest Daily Data Is More Nuanced
The FII story also needs careful interpretation.
Foreign investors have been a major source of pressure on Indian equities in 2026, with Reuters reporting that foreign investors had withdrawn around $24 billion from Indian equities during the year by September 2.
However, the latest daily data tells a more complicated story.
On September 1:
FII net buying: approximately ₹1,143 crore
DII net buying: approximately ₹1,847 crore
So it would be incorrect to say that FIIs were aggressively selling cash equities on September 1.
The bigger issue is the cumulative foreign-flow picture and positioning across equity, derivatives and currency markets.
This distinction makes the analysis stronger and more credible.
7. India’s Rupee Is Another Piece of the Puzzle
The rupee has also become an important market variable.
Despite pressure from crude oil and U.S. yields, the rupee remained around ₹94.97 per dollar on September 2, helped by RBI intervention.
The RBI has also strengthened its foreign-exchange buffer.
India’s forex reserves reached approximately $729.3 billion, while a special foreign-currency deposit initiative attracted substantial inflows.
This is actually a positive factor.
It means the current market weakness is not simply an Indian balance-of-payments crisis.
Instead, investors are dealing with a combination of:
Oil + global yields + geopolitics + valuation + foreign flows.
8. FDI Is a Different Story From FII
Another important correction is the difference between FDI and FII.
Foreign portfolio investment can move in and out of the stock market very quickly.
FDI is generally longer-term capital.
Recent data shows that India’s net FDI has weakened substantially, falling from $27.99 billion in FY23 to $6.95 billion in FY26, although gross FDI inflows actually reached a record $94.84 billion in FY26.
This distinction matters.
Gross FDI
Money coming into India before considering repatriation and other outflows.
Net FDI
Gross inflows minus relevant outflows/repatriation and other components.
Therefore, saying simply “foreign investors are abandoning India” would be misleading.
The reality is more nuanced.
9. Nifty 24,000 Has Become the Psychological Battlefield
The most important development for traders is technical.
Nifty closed:
September 1
24,055.80
September 2
23,914.45
That means the index has now slipped below the 24,000 psychological level.
The immediate technical framework is:
Resistance
24,000–24,055
If Nifty cannot reclaim this zone, it could remain under pressure.
Above that:
24,200–24,380
A sustained move above this zone would improve the short-term structure.
Support
23,900
Immediate support.
23,800
Important short-term support.
23,600–23,500
Major downside zone if selling accelerates.
10. India VIX Will Tell Us Whether This Is Panic or Controlled Selling
Nifty alone does not tell the entire story.
Traders should also watch India VIX, which measures expected Nifty volatility derived from option prices.
The key combination is:
Nifty ↓ + VIX ↑
Potentially stronger fear and downside risk.
Nifty ↓ + VIX stable
Could indicate a more orderly correction.
This is why professional traders often combine:
Nifty + India VIX + Option IV + PCR + OI + FII futures positioning
rather than relying on a single indicator.
11. The Biggest Irony: The Economy Is Actually Showing Strong Investment Growth
Perhaps the most important fact missing from the bearish GDP narrative is investment.
Real GFCF grew 11.9% in Q1 FY2026-27, up sharply from 5.8% in the corresponding period last year.
Gross fixed capital formation’s share of GDP also increased to 34.3%.
Reuters reported that private-sector investment is beginning to broaden, with capital expenditure across areas such as infrastructure, manufacturing, AI and data centres contributing to the investment cycle.
This means the argument that India’s growth is purely government-funded is becoming harder to sustain.
There are still risks—but the latest GDP data contains genuine evidence of private investment momentum.
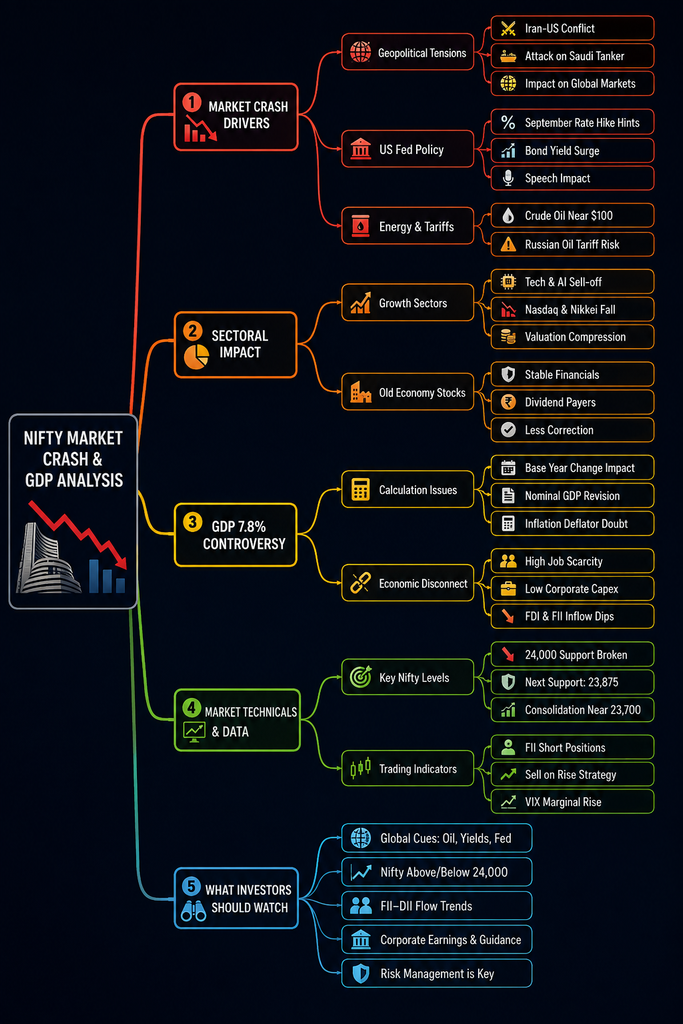
12. Why the Market Still Doesn’t Trust the GDP Number
So why didn’t Nifty rally?
Because the market is not trading today’s GDP.
It is trading tomorrow’s earnings and tomorrow’s interest rates.
The current market equation looks something like:
| Factor | Market Signal |
|---|---|
| GDP Growth | 🟢 Strong |
| Investment Growth | 🟢 Strong |
| Consumption | 🟢 Positive |
| Manufacturing | 🟢 Strong |
| Services | 🟢 Strong |
| Crude Oil | 🔴 Negative |
| U.S. Bond Yields | 🔴 Negative |
| Geopolitical Risk | 🔴 Negative |
| FII Cumulative Flow | 🔴 Negative |
| Rupee | 🟠 Under Pressure |
| Nifty Technical Structure | 🔴 Weak below 24,000 |
This explains the paradox.
India’s economy can be strong while India’s stock market is weak.
There is no contradiction.
13. The 7.8% GDP Number May Actually Become a Market Risk
There is another possibility.
If GDP remains extremely strong while inflation expectations rise, the RBI may have less reason to ease monetary policy.
That creates a strange situation:
Strong GDP → higher inflation/rate expectations → higher bond yields → lower equity valuation multiples
In other words, good economic news can sometimes become bad news for expensive stocks.
This is especially important when global bond yields are already elevated.
14. What Traders Should Watch Next
The next few sessions are likely to revolve around five variables:
1. Nifty 24,000
Reclaiming and sustaining above 24,000 would reduce immediate bearish pressure.
2. Nifty 23,800
A decisive break below this level could open the door toward 23,600–23,500.
3. Brent Crude
A move toward or above $100 would increase inflation and macro-risk concerns.
4. U.S. 10-Year Yield
A sustained move around/above 4.8% would remain a valuation headwind for emerging markets.
5. FII Derivatives Positioning
Cash-market flows alone are not enough. Futures and options positioning will be crucial for identifying whether institutions are hedging, reducing exposure,e or actively building bearish positions.
Final Verdict: GDP Is Strong. The Market Is Worried About Something Else.
The 7.8% GDP number should not simply be dismissed as an accounting illusion.
Official data shows genuine strength:
7.8% real GDP growth
8.2% GVA growth
11.9% investment growth
7.1% consumption growth
12% export growth
9.2% manufacturing growth
These are not insignificant numbers.
But equity markets are facing a completely different set of problems.
Crude oil is near $97.
U.S. Treasury yields are near 4.8%.
Fed hike expectations have risen sharply.
Geopolitical risk remains elevated.
Foreign investors have withdrawn substantial capital over the year.
And Nifty has fallen below 24,000.
Therefore, the real “7.8% paradox” is not that India’s GDP is fake.
It is this:
India’s economy is growing faster than investors currently want to pay for.
That is the distinction traders need to understand.
The market is not necessarily saying:
“India is not growing.”
It may be saying:
“Growth is strong, but global risk, oil, interest rates and valuations matter more right now.”
For traders, 24,000 remains the key psychological line.
A sustained reclaim could bring the bulls back into control.
A failure to reclaim it, followed by a break of 23,800, would keep the bearish structure alive.
And that is why, in the current environment, price action + liquidity + institutional positioning + macro data are more useful than GDP headlines alone.
Key Data: India Market & Economy
| Indicator | Latest Data |
|---|---|
| Q1 FY27 Real GDP Growth | 7.8% |
| Q1 FY27 Real GVA Growth | 8.2% |
| Nominal GDP Growth | 10.3% |
| Investment/GFCF Growth | 11.9% |
| Household Consumption Growth | 7.1% |
| Export Growth | 12.0% |
| Manufacturing Growth | 9.2% |
| Services Growth | 10.0% |
| Financial/Real Estate/IT/Professional Services | 12.1% |
| Nifty Sep 2 Close | 23,914.45 |
| Nifty Sep 2 Change | -141.35 (-0.59%) |
| Key Nifty Level | 24,000 |
| Immediate Support | 23,800–23,900 |
| Major Support | 23,500–23,600 |
| Brent Crude | ~$96.59/bbl |
| WTI Crude | ~$91.58/bbl |
| U.S. 10Y Yield | ~4.8% |
| India Forex Reserves | ~$729.3 billion |
| Sep 1 FII Flow | +₹1,143 crore |
| Sep 1 DII Flow | +₹1,847 crore |
Disclaimer
Disclaimer: This article is provided for educational and informational purposes only and does not constitute investment, financial, trading, or stock-market advice.
The GDP figures, Nifty levels, FII/DII data, crude oil prices, bond yields, geopolitical developments, options data, and other market information mentioned in this article are based on publicly available sources and may change or contain inaccuracies. Market analysis and technical levels represent the author’s interpretation and are not guaranteed predictions.
Trading and investing in stocks, futures, and especially options involve substantial risk, including the possibility of significant financial loss. Past performance does not guarantee future results.
Readers should conduct their own research and consult a SEBI-registered investment adviser or qualified financial professional before making any investment or trading decision.
The author and publisher are not responsible for any profit or loss arising from decisions made based on the information presented in this article.
High-CTR Titles
- India GDP Grows 7.8%, But Nifty Crashes Below 24,000: Here’s Why
- 7.8% GDP vs Falling Nifty: The 5 Forces Driving India’s Stock Market
- Why Strong GDP Couldn’t Save Nifty: Crude Oil, Fed and FII Risks Explained
- Nifty Below 24,000 Despite 7.8% GDP: What Investors Need to Know
- India’s 7.8% GDP Shock: Why the Stock Market Is Still Bearish
- The 7.8% GDP Paradox Explained: Why India’s Market Is Falling
- Nifty 50 Crash Explained: GDP Is Strong, So Why Are Stocks Falling?
- 7.8% GDP, $97 Oil and Nifty Below 24,000: India’s New Market Reality
- India GDP Growth Is Strong—So Why Is Nifty Falling? 5 Reasons Explained
- Nifty 24,000 Breaks: The Hidden Risks Behind India’s 7.8% GDP Growth