
India’s 7.8% GDP Growth vs Nifty’s Reality: Why Are Stocks Falling?
India’s economy delivered a powerful growth surprise, but the stock market refused to celebrate.
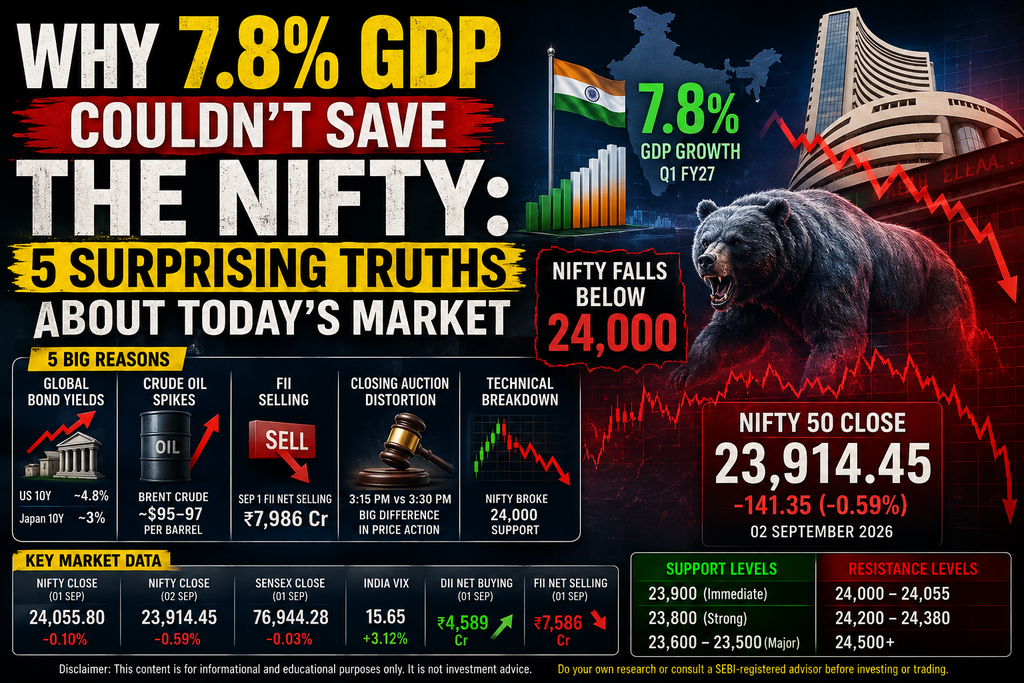
India’s real GDP grew 7.8% year-on-year in Q1 FY27 (April–June 2026), comfortably above expectations and stronger than the earlier Reserve Bank of India projection. Economists subsequently raised their FY27 growth forecasts, with the consensus moving towards roughly 7.2%.
Yet the Nifty 50 remained under pressure.
On September 1, the Nifty closed at 24,055.80, down around 0.10%, despite the strong GDP number. The Sensex also slipped marginally to 76,944.28.
The following session made the picture even more interesting. On September 2, Nifty fell another 141.35 points, or 0.59%, to 23,914.45, finally closing below the psychologically important 24,000 mark.
So, if India’s economy is growing at 7.8%, why is the stock market struggling?
The answer lies in five forces: global bond yields, crude oil, foreign selling, closing-auction volatility and the market’s technical structure.
1. The GDP-Stock Market Divorce Is Becoming Clearer
A strong GDP number does not automatically translate into higher stock prices.
GDP measures economic activity. Equity markets, however, discount future earnings, interest rates, liquidity, valuation and risk premiums.
That distinction is particularly important now.
India’s Q1 FY27 growth was supported by manufacturing, services and domestic demand. But investors are simultaneously dealing with:
- Higher crude oil prices
- Rising global bond yields
- Geopolitical uncertainty
- Foreign institutional selling
- Pressure on selected banking and auto stocks
- A stronger risk premium for emerging markets
Therefore, the market is effectively asking:
“How much of this 7.8% growth will actually become future corporate earnings?”
That is a very different question from whether GDP growth itself is strong.
Economists have already raised several FY27 growth estimates after the GDP surprise, but some analysts continue to highlight risks from high crude prices, base effects, rural demand and global financial conditions.
The key lesson
GDP is backward-looking economic evidence; the stock market is forward-looking pricing.
That is why a record economic growth number can coexist with a falling index.
2. The 3:15 PM vs 3:30 PM Effect: Why the Closing Auction Matters
One of the most interesting developments in India’s equity market is the new Closing Auction Session (CAS).
NSE’s official framework specifies that the Closing Auction Session operates separately from continuous trading. The reference-price transition begins at 3:15 PM, followed by order collection and matching, with trade confirmation between 3:30 PM and 3:35 PM.
This is important because the price visible at the end of continuous trading can differ materially from the final closing price.
September 1 example
On September 1, the Nifty had remained under pressure during the session and recovered a substantial portion of its losses during the closing auction. The index ultimately finished at 24,055.80, down only around 24 points.
This does not automatically prove manipulation.
Instead, it demonstrates something traders need to understand:
The final closing price can be influenced by order matching during the auction and may not tell the complete story of intraday supply and demand.
For traders analysing market sentiment, the continuous-session structure can therefore provide additional information that the final closing print alone may hide.
3. The Global Bond Market Is Becoming a Bigger Problem
The biggest surprise for many investors is that India’s domestic growth story is currently competing with a rapidly changing global interest-rate environment.
Japan’s 10-year government bond yield crossed 3%, a level not seen since 1996. At the same time, U.S. Treasury yields moved sharply higher, with the U.S. 10-year yield approaching 4.8%.
This matters for India because global investors constantly compare:
Emerging-market equity returns vs. developed-market bond yields.
When U.S. and Japanese bond yields rise, the relative attractiveness of riskier assets can decline.
Why Japan matters
Japan has historically been an important source of global capital because investors could borrow cheaply in yen and invest elsewhere.
When Japanese yields rise, the economics of that trade can change.
However, it would be too simplistic to say that every rise in Japanese yields automatically causes a massive yen-carry-trade reversal. The actual capital-flow response depends on currency expectations, hedging costs, relative yields and investor positioning.
The important point is that Japan’s move toward a higher-yield environment adds another source of global financial tightening.
4. Crude Oil Has Become India’s Biggest Macro Vulnerability
If there is one external variable that Indian equity investors cannot ignore right now, it is crude oil.
Brent crude moved above $90 per barrel and approached the mid-$90s amid renewed Middle East tensions. Reuters reported Brent around $95 per barrel on September 2, while domestic market reports put Brent near $96.59.
For India, this is particularly important because the country is heavily dependent on imported crude.
Higher crude can create a chain reaction:
Higher oil → larger import bill → pressure on rupee → inflation risk → higher interest-rate expectations → lower equity valuations
That explains why strong GDP data could not completely overpower negative global macro signals.
The market is essentially saying:
Strong growth is positive, but expensive oil can reduce the quality and sustainability of that growth.
5. FII Selling vs DII Buying: The Battle Beneath the Index
Institutional flows provide another important clue.
For September 1, available market data showed a large divergence between foreign and domestic institutional activity, with foreign investors selling heavily while domestic institutions continued buying. Market reports recorded FII net selling of roughly ₹7,986 crore and DII buying of around ₹4,589 crore for that session.
This creates an interesting market structure.
FII behaviour
Foreign investors are more sensitive to:
- U.S. Treasury yields
- Dollar strength
- Crude prices
- Global risk appetite
- Emerging-market valuation
- Geopolitical risk
DII behaviour
Domestic institutions can provide a stabilising counter-flow through:
- Mutual fund inflows
- Insurance capital
- Pension allocations
- Domestic savings
Therefore, the Nifty can remain relatively resilient even when FIIs are selling aggressively.
But there is an important warning:
DII buying can absorb selling pressure without necessarily creating a new bullish trend.
It can simply slow the decline.
6. Bank Nifty and Auto Stocks Are Sending Different Signals
The sectoral picture also tells an important story.
On September 1, banking stocks were among the weaker areas, with the bank index falling around 1.1%, while auto stocks were also under pressure. Maruti Suzuki, for example, fell sharply after its August sales data.
On September 2, the weakness became broader.
The Nifty Auto index came under significant pressure as higher crude prices and disappointing August sales affected sentiment across automobile stocks.
This is important because banks and autos are both major domestic-economy proxies.
When GDP is strong but economically sensitive sectors are weak, the market may be signalling:
“The economy is growing, but investors are worried about margins, valuations and future conditions.”
7. The 24,000 Nifty Level Finally Broke
This is where the technical picture becomes particularly important.
On September 1, Nifty closed at:
24,055.80
That meant the index was still technically holding above 24,000.
But on September 2:
Nifty Close: 23,914.45
Day Change: -141.35 points
Percentage Change: -0.59%
The index therefore lost the 24,000 psychological support on a closing basis.
Important Nifty levels
Based on the recent price structure, traders can watch:
Resistance
- 24,000–24,055: Previous support turned immediate resistance
- 24,200–24,380: Important recovery zone
- 24,500+: Bullish reversal zone
Support
- 23,900: Immediate psychological/technical zone
- 23,800: Important short-term support
- 23,600–23,500: Next major downside zone
A sustained recovery above 24,000–24,100 would reduce immediate bearish pressure.
A failure to reclaim 24,000, followed by a break below 23,800, would increase the probability of another leg lower.
8. India VIX: The Market’s Fear Gauge
Another number traders should watch is India VIX.
India VIX is derived from NIFTY option prices and represents the market’s expected volatility over the coming 30 calendar days.
The important relationship is:
Nifty ↓ + VIX ↑
Usually indicates increasing fear and stronger downside risk.
Nifty ↓ + VIX stable/falling
Can indicate controlled correction rather than panic.
Therefore, simply looking at the Nifty level is not enough.
A trader should combine:
Nifty + India VIX + PCR + IV + OI + FII futures positioning
to understand whether a decline is becoming a genuine trend or simply another range-bound correction.
9. The “Managed Index” Theory: What Traders Should Actually Watch
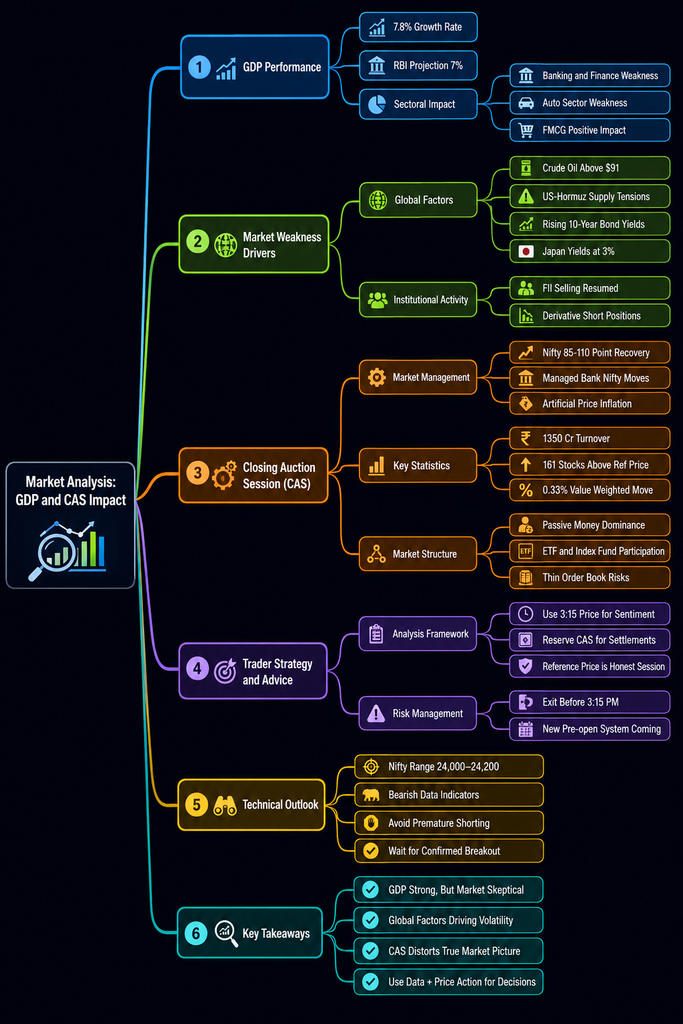
There has been growing discussion among traders about large end-of-day movements and whether the new auction mechanism can distort the apparent closing picture.
But there is an important distinction.
What we know
NSE has formally introduced the Closing Auction Session, with specific rules for reference prices, order collection, matching and price bands.
What we should not automatically conclude
A sharp auction recovery does not by itself prove that the index was manipulated.
Large institutional orders, passive flows, benchmark tracking, rebalancing and auction mechanics can all contribute to unusual closing movements.
Therefore, rather than calling every late recovery “managed,” traders should examine:
- 3:15 PM reference level
- Auction turnover
- Breadth
- Futures premium/discount
- Option IV
- OI changes
- FII index futures positioning
- Individual-stock closing moves
This gives a much more reliable picture.
10. The September 2 Confirmation: GDP Was Not Enough
The biggest confirmation came one day later.
Despite India’s strong GDP growth story, Nifty dropped below 24,000 on September 2.
At the same time:
- Brent crude moved toward $95–97
- U.S. bond yields remained elevated
- Japan’s 10-year yield remained around the historic 3% zone
- Global equity markets were under pressure
- Auto stocks faced heavy selling
- Geopolitical risks remained elevated
Reuters specifically highlighted oil-supply and inflation concerns as major reasons for the Indian market decline.
This is the clearest explanation for the GDP paradox.
India’s economy can be strong while India’s stock market is weak.
Both statements can be true at the same time.
What Traders Should Do Now
The current market should not be analysed using GDP alone.
A practical framework is:
Bullish Scenario
If Nifty:
23,800 holds → 24,000 reclaimed → 24,200 breaks
then short-covering and fresh buying could push the index toward 24,380–24,500.
Bearish Scenario
If Nifty:
fails below 24,000 → breaks 23,800 → VIX rises
then the next downside zones become 23,600 and 23,500.
High-Risk Scenario
If crude continues rising toward/above $100 while global bond yields remain elevated, the market could face another valuation compression even if domestic GDP remains strong.
Final Verdict: Trust GDP or Price Action?
The answer is:
Use both—but for different purposes.
GDP tells us about the health of the economy.
Price action tells us about what investors are willing to pay for future earnings.
Right now, India’s economic engine is strong, but the financial-market environment is becoming increasingly difficult.
The combination of:
7.8% GDP growth + high crude oil + rising global yields + FII selling + geopolitical risk + technical weakness
creates a market where good economic news can coexist with falling stock prices.
The most important level now is no longer simply the GDP number.
It is 24,000 on the Nifty.
If bulls reclaim and sustain this level, the recent breakdown can turn into another false move.
If the index remains below 24,000 and breaks 23,800, the market’s message becomes much more bearish.
The real question for investors is therefore not:
“Is India growing?”
It clearly is.
The real question is:
“At what price are investors willing to own that growth?”
And right now, the answer from the Nifty is considerably more cautious than the 7.8% GDP headline suggests.
Key Market Data at a Glance
| Indicator | Latest/Relevant Data |
|---|---|
| India Q1 FY27 GDP Growth | 7.8% YoY |
| Nifty Close – Sep 1 | 24,055.80 |
| Nifty Close – Sep 2 | 23,914.45 |
| Sep 2 Nifty Change | -141.35 / -0.59% |
| Key Psychological Level | 24,000 |
| Immediate Support | 23,800 |
| Next Support Zone | 23,600–23,500 |
| Immediate Resistance | 24,000–24,055 |
| Higher Resistance | 24,200–24,380 |
| Brent Crude | ~$95–97/bbl |
| Japan 10Y Yield | ~3% |
| U.S. 10Y Yield | ~4.8% |
| Sep 1 FII Net Flow* | ~₹7,986 Cr selling |
| Sep 1 DII Net Flow* | ~₹4,589 Cr buying |
*Institutional-flow figures are based on reported market data; date/settlement conventions can differ across data providers.
Disclaimer
Disclaimer: This article is published for educational and informational purposes only and should not be considered investment advice, financial advice, trading advice, or a recommendation to buy or sell any security, stock, index, futures, options, or other financial instrument.
Market data, GDP figures, FII/DII flows, crude oil prices, bond yields, technical levels, options data, and other information mentioned in this article are based on publicly available sources and may change or contain errors. Technical levels and market scenarios are interpretations, not guaranteed predictions.
Trading and investing in equities, futures, and especially options involve substantial risk, including the possibility of losing your entire invested capital. Past performance does not guarantee future results.
Readers should conduct their own research and consult a SEBI-registered investment adviser or qualified financial professional before making investment decisions.
The author/publisher shall not be responsible for any direct or indirect loss arising from decisions made based on the information presented in this article.
high-CTR + SEO Top 10 titles:
- Why 7.8% GDP Couldn’t Save Nifty: 5 Reasons Behind India’s Market Sell-Off
- Nifty Crashes Below 24,000 Despite 7.8% GDP: What’s Really Happening?
- India GDP at 7.8%, But Nifty Falls: 5 Big Reasons Investors Are Worried
- Nifty 24,000 Breaks: Why Strong GDP Failed to Lift the Indian Stock Market
- 7.8% GDP vs Falling Nifty: The Hidden Forces Driving India’s Market
- Why Is Nifty Falling Despite India’s Strong 7.8% GDP Growth? Explained
- Nifty Market Crash Explained: Crude Oil, FII Selling and Global Yields Hit India
- Nifty Below 24,000: FII Selling, Crude Oil and Bond Yields Raise Bearish Risks
- India’s 7.8% GDP Surprise Couldn’t Stop Nifty: What Traders Need to Know
- Nifty 50 Outlook: 7.8% GDP, Rising Oil and FII Selling Create a Market Puzzle