

Introduction: The End of Easy Market Gains?
The Indian stock market can move through different investment regimes. During periods of abundant liquidity, investors may reward high-growth companies and momentum stocks with premium valuations. When interest rates rise, inflation remains elevated, or institutional investors reduce risk, the market can become much less forgiving.
In such conditions, even established companies can experience sharp price declines. A strong brand, a popular business model or a history of profitability does not automatically guarantee attractive future returns.
Investors therefore need to look beyond short-term price movements and evaluate the financial strength, cash generation, competitive position and valuation of the companies they own.
The central question is not simply whether the market will recover next month. It is whether your portfolio contains businesses capable of surviving economic stress while generating sustainable returns over several years.
This article examines five important lessons for investors navigating a changing market environment.
1. The Sector Story Trap: Why Popular Investment Themes Can Become Expensive
Electric vehicles, artificial intelligence, defence, renewable energy and semiconductors have attracted considerable investor attention. These industries may offer substantial long-term opportunities, but an attractive industry does not automatically make every company within it a good investment.
The biggest risk arises when investors pay too much for future growth that has not yet translated into profits or cash flow.
Understanding the impact of interest rates on valuations
A stock’s theoretical value depends partly on the cash flows investors expect to receive in the future and the rate used to discount those cash flows.
The basic present-value formula is:
PV = FV / (1 + r)ᵗ
Where:
- PV = present value
- FV = future value
- r = discount rate
- t = time until the cash flow is received
Consider a hypothetical company expected to generate ₹100 in value after a specified period.
| Time horizon | Value discounted at 5% | Value discounted at 7% | Approximate reduction |
|---|---|---|---|
| 1 year | ₹95.24 | ₹93.46 | 1.9% |
| 5 years | ₹78.35 | ₹71.30 | 9.0% |
| 10 years | ₹61.39 | ₹50.83 | 17.2% |
Illustrative calculations using a single future payment of ₹100. They are not stock-price forecasts.
The longer the investor must wait for the expected cash flow, the more sensitive its present value can become to changes in discount rates.
This is one reason why companies valued primarily on distant future earnings may experience substantial valuation adjustments when interest rates rise.
Three questions to ask before buying a popular stock
- Is the company already generating operating cash flow?
- How much future growth is already reflected in the share price?
- Can the business maintain its competitive position if financing becomes more expensive?
Investor takeaway: Evaluate the company’s actual financial performance alongside its growth opportunity. A promising industry and an attractive stock valuation are two different things.
2. Why Buy-and-Forget Investing Requires Regular Reviews
Long-term investing can be an effective strategy, but it does not mean holding every stock indefinitely regardless of changes in business fundamentals.
Technology, competition, consumer preferences, and regulation can alter a company’s prospects. A previously successful business may lose pricing power, while a new competitor develops a more efficient business model.
The relevant question is whether the original investment thesis remains valid.
Business quality can change over time
Consider three hypothetical situations:
- A technology company loses customers because competitors introduce better products.
- A consumer business experiences declining margins because input costs increase faster than selling prices.
- A manufacturing company loses market share because its competitors adopt more efficient production methods.
In each situation, the historical reputation of the business may be less important than its current competitive position.
A practical review checklist
| Factor | What to examine |
|---|---|
| Revenue growth | Is demand increasing or weakening? |
| Operating margins | Can the business maintain profitability? |
| Market share | Is the company gaining or losing customers? |
| Innovation | Is the company adapting to industry changes? |
| Debt | Can it meet financial obligations during a downturn? |
| Valuation | Does the current share price reasonably reflect prospects? |
A falling stock price alone is not sufficient reason to sell. Equally, a historically successful company should not be treated as permanently safe.
Investor takeaway: Review the investment thesis periodically and distinguish temporary market volatility from a lasting deterioration in business quality.
3. Cash Is King: Why Balance-Sheet Strength Matters
When financing conditions become difficult, companies with substantial debt can face greater pressure than businesses with strong cash reserves and manageable obligations.
Higher borrowing costs can increase interest expenses, reduce profitability and limit the amount of capital available for expansion.
Businesses with stronger balance sheets may have more flexibility to continue investing, manage temporary disruptions and pursue opportunities when competitors are under pressure.
Net cash: A useful starting point
Investors can calculate a basic net cash measure using the following formula:
Net Cash = Cash + Liquid Investments − Total Debt
For example, suppose a company has:
- Cash and liquid investments: ₹500 crore
- Total debt: ₹300 crore
Its net cash position would be ₹200 crore.
Now consider another company with ₹150 crore in cash and ₹600 crore in debt. It would have net debt of ₹450 crore.
The second company may face greater financial pressure if earnings weaken or refinancing becomes expensive, although the complete assessment also depends on its cash flows, debt maturity schedule and access to financing.
Important balance-sheet metrics
| Metric | What it helps evaluate |
|---|---|
| Net cash or net debt | Overall cash and debt position |
| Debt-to-equity ratio | Debt relative to shareholder equity |
| Interest coverage ratio | Ability to cover interest expenses from operating earnings |
| Current ratio | Short-term assets relative to short-term liabilities |
| Debt maturity profile | Timing of repayment and refinancing requirements |
No single ratio determines whether a company is financially healthy. Capital-intensive industries may naturally operate with more debt, while financial companies require sector-specific analysis.
Why cash reserves can provide flexibility
A financially resilient business may be better positioned to fund capital expenditure, maintain operations during a slowdown and avoid raising equity at unfavourable prices.
However, cash alone does not guarantee superior investment returns. Investors should also examine how efficiently management deploys that cash and whether the business is available at a reasonable valuation.
Investor takeaway: Assess liquidity, debt, cash generation and refinancing requirements together rather than relying only on reported net profit.
4. Free Cash Flow: The Difference Between Accounting Profit and Cash Generation
Reported profits are important, but they do not always indicate how much cash a company generates from its operations.
Revenue may be recognised before customers pay, inventory may accumulate, and non-cash accounting items can influence reported earnings.
Free cash flow provides another perspective by examining the cash remaining after operating activities and capital expenditure.
The free cash flow formula
Free Cash Flow = Operating Cash Flow − Capital Expenditure
Suppose a company reports the following annual figures:
| Financial measure | Amount |
|---|---|
| Operating cash flow | ₹250 crore |
| Capital expenditure | ₹100 crore |
| Free cash flow | ₹150 crore |
| Net profit | ₹180 crore |
In this example, the business generates ₹150 crore in free cash flow, compared with reported net profit of ₹180 crore.
The difference is not automatically a warning sign. Capital expenditure, working-capital movements and the timing of customer payments can create legitimate differences between accounting profits and cash generation.
The important question is whether the pattern is sustainable over several years.
Cash-flow indicators investors should monitor
Operating cash flow: Examine whether the company consistently converts its business activity into cash.
Free cash flow: Determine whether the business can fund investment and meet other financial needs without depending excessively on external financing.
Receivables: Compare the growth in amounts owed by customers with the revenue growth.
Inventory: Investigate whether inventory is accumulating faster than sales and whether there is a risk of obsolescence.
Capital expenditure: Distinguish necessary investment for future growth from spending that may not generate adequate returns.
Dilution: Review whether repeated share issuance is financing sustainable expansion or covering persistent cash shortfalls.
What is cash conversion?
One useful comparison is operating cash flow relative to reported earnings or operating profit.
A consistently strong relationship between earnings and cash generation can provide evidence of earnings quality. However, the appropriate calculation depends on the denominator used, the industry and the company’s working-capital cycle.
A universal threshold should not replace company-specific analysis.
Investor takeaway: Use several years of cash-flow statements, balance sheets and income statements to assess earnings quality rather than relying on one financial year’s reported profit.
5. A Three-Pillar Portfolio Audit: Fundamentals, Financial Strength and Valuation
Investors can organise their research into three main categories to make portfolio reviews more systematic.
Pillar 1: Cash-flow quality
Questions to consider:
- Does the business generate cash from its main operations?
- Is free cash flow positive over a meaningful period?
- Are profits supported by actual cash collection?
- Is capital expenditure producing reasonable returns?
Pillar 2: Balance-sheet resilience
Questions to consider:
- Is the company’s debt manageable?
- Can operating earnings cover interest expenses?
- Are sufficient liquid resources available for near-term obligations?
- Does the company face significant refinancing requirements?
Pillar 3: Valuation discipline
Questions to consider:
- Is the share price reasonable relative to earnings and cash flow?
- Are earnings expectations realistic?
- How does the valuation compare with relevant competitors?
- What could happen to the valuation if growth slows?
Portfolio decision framework
| Assessment | Possible interpretation | Questions before acting |
|---|---|---|
| Fundamentals, balance sheet and valuation all appear sound | Potentially suitable for further research or continued ownership | Does the position fit your objectives and risk limits? |
| Business quality is reasonable, but valuation is stretched | Additional purchases may require caution | What growth is already reflected in the price? |
| Fundamentals remain strong, but cash flow is temporarily weak | Further investigation may be necessary | Is the weakness temporary, seasonal or structural? |
| Debt, cash flow and competitive position are deteriorating | Elevated business risk | Does the original investment thesis still hold? |
| Valuation appears low, but earnings are declining structurally | Possible value trap | Is the business capable of recovering sustainably? |
This framework is a research aid, not an automatic buy, hold or sell signal. Investors should consider taxes, transaction costs, diversification, investment horizons and their individual financial circumstances.
Understanding the P/E ratio
The price-to-earnings ratio compares a company’s share price with its earnings per share.
For example, a stock trading at ₹400 with annual earnings per share of ₹20 has a P/E ratio of 20.
A lower P/E does not automatically mean the stock is cheap. The valuation could reflect weak growth expectations, declining profitability, or significant business risks.
Similarly, a high P/E may reflect expected growth, but investors must assess whether that growth is achievable.
A useful approach is to compare valuation with earnings growth, cash generation, balance-sheet quality, competitive position and industry characteristics rather than relying on one universal formula.
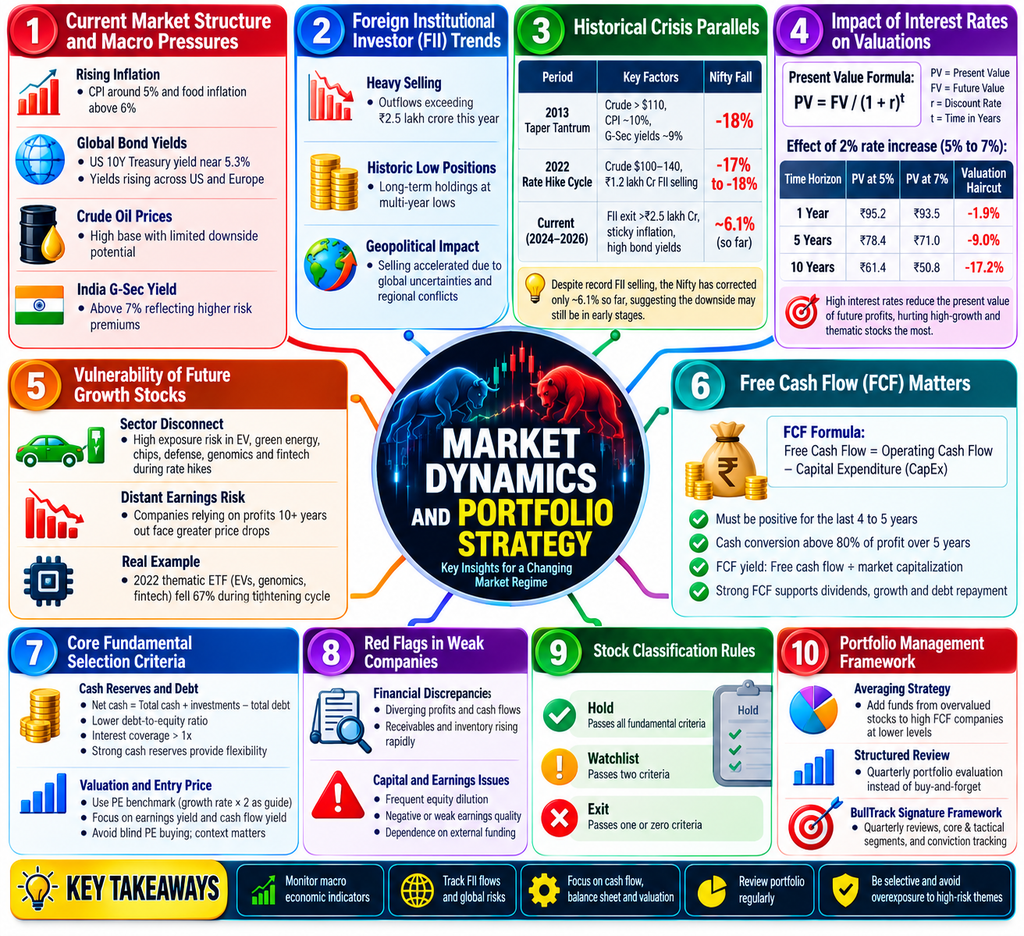
Historical Market Corrections: What Investors Can Learn
Past market corrections can provide useful context about how interest rates, liquidity and investor sentiment interact. However, different periods have different starting valuations, economic conditions and policy responses.
The following figures are historical reference points cited in the original research draft, not a fully verified historical dataset.
| Market period | Factors to investigate |
|---|---|
| 2013 Taper Tantrum | US monetary-policy expectations, rupee volatility, oil prices and foreign capital flows |
| 2022 global rate-hiking cycle | Rising interest rates, valuation adjustments and foreign portfolio outflows |
| Current market environment | Interest rates, inflation, institutional flows, earnings expectations and equity valuations |
Investors should not assume that the current market must repeat the magnitude or timing of a previous correction simply because some indicators look similar.
A historical comparison becomes more useful when it includes the starting valuation, inflation conditions, earnings growth, currency performance and the duration of the market decline.
A Practical Quarterly Portfolio Review
A quarterly review can help investors identify risks before they become more significant.
Step 1: Review business performance. Compare quarterly revenue, earnings, margins and management guidance with previous periods.
Step 2: Review cash flows. Check operating cash flow, capital expenditure, free cash flow, receivables and inventory.
Step 3: Review debt and liquidity. Examine net debt, interest coverage, debt maturities and funding requirements.
Step 4: Review valuation. Compare the current price with earnings, cash flow, historical valuation ranges and industry peers.
Step 5: Review portfolio concentration. Identify excessive exposure to individual companies, sectors, business cycles or common economic risks.
Step 6: Document the investment thesis. Record why the company was purchased, what evidence would support continued ownership,p and what changes would require reassessment.
Step 7: Rebalance when appropriate. Consider whether allocations remain consistent with the investor’s objectives, risk tolerance and time horizon.
This process can reduce reliance on market rumours, short-term price movements and emotional decisions.
Conclusion: Stop Guessing and Start Auditing
Changing market conditions can expose weaknesses that remain less visible during periods of strong liquidity and rising share prices. Popular investment themes may become expensive, debt can magnify financial stress, and reported profits may fail to translate into sustainable cash generation.
For investors, the practical response is to evaluate each business using a consistent framework built around cash flow, balance-sheet strength, competitive position and valuation.
A market correction does not automatically make every declining stock attractive, and a high-quality company does not guarantee a good return at every purchase price.
The objective is not to predict the exact market bottom. It is to understand the businesses you own, recognise the risks you are taking and make decisions that are consistent with your financial goals.
Five key lessons to remember:
- Separate a promising industry from an attractively valued stock.
- Review business fundamentals instead of holding stocks blindly.
- Understand debt, liquidity, and refinancing risks.
- Compare accounting profits with operating cash flow.
- Apply a repeatable portfolio review process.
The most useful question for every investor is this: if market conditions remain difficult for another year, are the companies in your portfolio financially equipped to manage that environment?
Frequently Asked Questions
1. What is a new market regime?
A new market regime describes a period in which important market drivers, such as inflation, interest rates, liquidity, earnings growth or investor risk appetite, differ from the conditions that previously supported asset prices.
2. Why do high-growth stocks sometimes fall when interest rates rise?
Higher discount rates reduce the present value of future cash flows. Companies whose expected profits are concentrated far in the future can therefore experience greater valuation sensitivity, although the actual effect depends on their growth, profitability and starting valuation.
3. What is free cash flow, and why is it important?
Free cash flow is commonly calculated as operating cash flow minus capital expenditure. It helps investors assess how much cash a business generates after funding its capital investment, although interpretation varies by industry and business model.
4. How can investors assess a company’s financial strength?
Investors can review net debt, liquidity, interest coverage, operating cash flow, debt maturities, profitability, and the stability of the company’s business model. No single metric is sufficient on its own.
5. Is a low P/E ratio a sign that a stock is undervalued?
Not necessarily. A low P/E may indicate attractive valuation, but it can also reflect declining earnings, weak growth prospects,s or structural business risks. Valuation should be assessed alongside financial performance and prospects.
6. Should investors sell every stock that fails one portfolio test?
A single metric should not automatically determine an investment decision. Investors should investigate the reasons for a weak result, compare the company with relevant peers and consider their own investment objectives, time horizon and risk tolerance.
7. How often should investors review their portfolios?
Quarterly reviews are a useful starting point for many long-term investors, with additional reviews when there are material changes in company fundamentals, financial risk or personal circumstances. Short-term traders may require more frequent monitoring.
Disclaimer
This article is for educational and informational purposes only and does not constitute financial or investment advice. Financial metrics, historical comparisons, and illustrative calculations are provided to explain investment concepts, not to guarantee future performance. Readers should independently verify company financial statements, conduct their own research,h and consult a qualified financial advisor before making investment decisions. Stock market investments are subject to market risks, including the potential loss of capital.
Top 10 SEO Titles
- Is Your Portfolio Ready for the New Market Regime? 5 Hard Truths
- New Market Regime 2026: 5 Investment Lessons Every Investor Must Know
- Stock Market Investing 2026: 5 Portfolio Risks You Should Not Ignore
- How to Protect Your Stock Portfolio During Market Volatility
- Free Cash Flow vs Net Profit: What Stock Investors Must Know
- Stock Valuation Explained: Why High-Growth Stocks Can Fall
- Portfolio Management Strategies: 5 Ways to Reduce Investment Risk
- Balance Sheet Analysis: How to Identify Financially Strong Companies
- Is Buy-and-Hold Investing Still Effective in 2026?
- Stock Market Correction: How to Audit Your Portfolio for Hidden Risks