
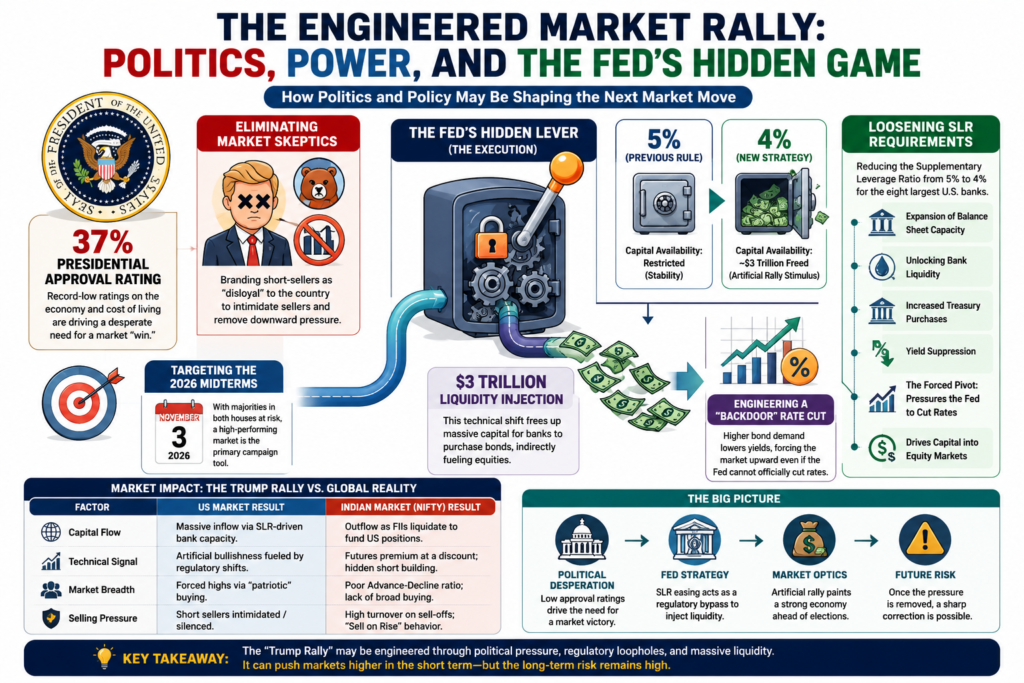
Is a Trump Rally Being Engineered? The Hidden Fed Strategy, SLR Liquidity & the Global Market Ripple Effect
Is the Stock Market Entering an Artificial Rally?
Financial markets rarely move on earnings alone.
Sometimes they move because of liquidity.
Sometimes, because of politics.
And sometimes because of expectations.
With investors closely watching policy decisions, banking regulations, and election-related developments, a growing debate has emerged:
Is the latest market optimism driven by improving fundamentals—or by financial conditions becoming easier?
Market Snapshot
| Indicator | Possible Market Impact |
|---|---|
| Banking Regulation | Liquidity Conditions |
| Treasury Yields | Equity Valuations |
| Dollar Index | Global Capital Flows |
| FII Activity | Emerging Market Performance |
| Election Sentiment | Market Volatility |
Understanding the SLR Mechanism
The Supplementary Leverage Ratio (SLR) is a banking regulation that requires large banks to hold capital against their assets.
If regulatory requirements are relaxed:
- Banks may have greater balance-sheet flexibility.
- Demand for government securities can increase.
- Financial conditions may ease.
- Risk assets often receive additional support.
Liquidity Flow
SLR Easing
      │
      ▼
Higher Bank Capacity
      │
      ▼
More Treasury Purchases
      │
      ▼
Lower Bond Yields
      │
      ▼
Higher Equity Liquidity
Why Bond Yields Matter
Lower Treasury yields generally make equities more attractive.
Lower Bond Yield
        │
        ▼
Lower Discount Rate
        │
        ▼
Higher Equity Valuation
Global Capital Rotation
When US assets become relatively more attractive, international capital allocation may shift.
US Market Strength
        │
        ▼
Global Funds Rebalance
        │
        ▼
Capital Moves
        │
        ├──► US Equities
        │
        └──► Emerging Markets Face Pressure
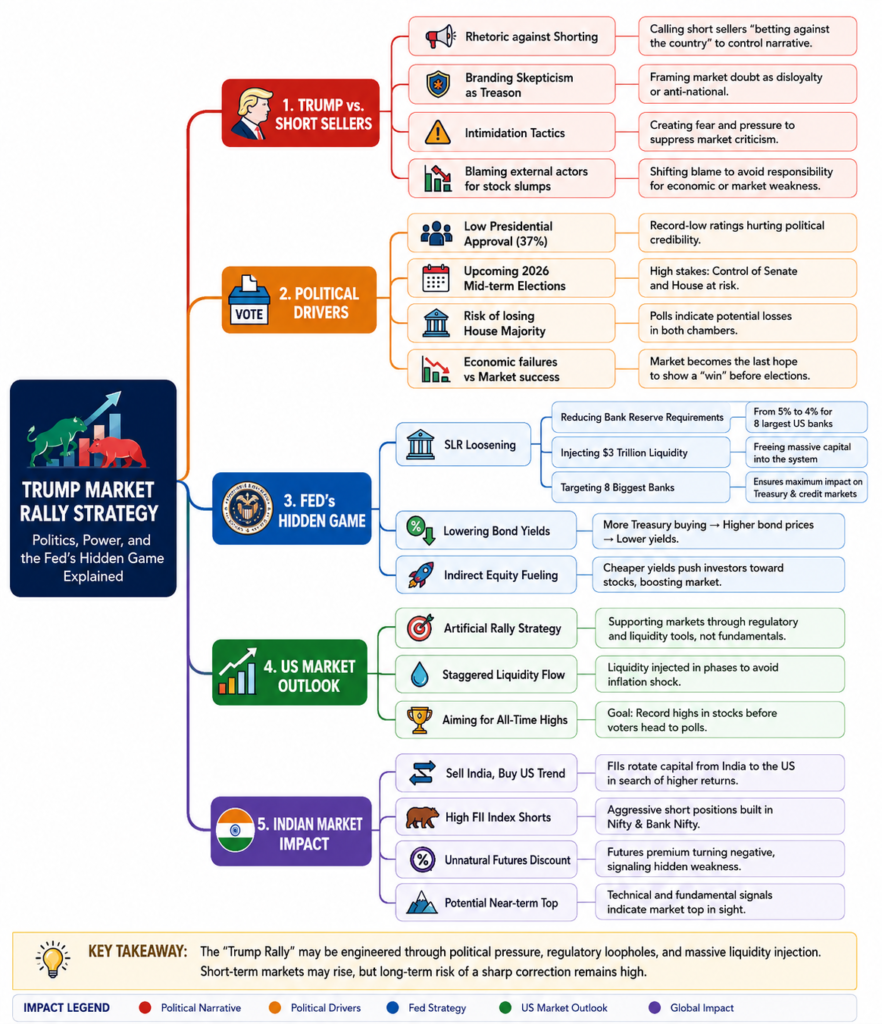
Impact on India
If global investors increase allocations toward US assets:
- FII flows into emerging markets may slow.
- Currency volatility can increase.
- Growth sectors like IT and Financials may become more sensitive to global sentiment.
- Market leadership may narrow.
India Risk Matrix
| Factor | Possible Impact |
|---|---|
| FII Selling | Negative |
| Strong Dollar | Moderate Risk |
| Higher US Liquidity | Capital Rotation |
| RBI Policy | Domestic Support |
| Corporate Earnings | Key Driver |
Technical Market Structure
Professional investors typically monitor:
- Market breadth
- Futures premium
- Options positioning
- Advance–Decline Ratio
- Institutional flows
A rally supported by broad participation is generally considered healthier than one driven by a handful of large-cap stocks.
Breadth Analysis
Healthy Rally

Price ↑
Breadth ↑
Volume ↑

---------------------

Weak Rally

Price ↑
Breadth ↓
Volume Mixed
Key Indicators to Watch
| Indicator | Why It Matters |
|---|---|
| US 10-Year Treasury Yield | Global liquidity |
| Dollar Index (DXY) | Capital flows |
| FII/DII Activity | Institutional positioning |
| India VIX | Risk appetite |
| Nifty Market Breadth | Strength of rally |
| Corporate Earnings | Fundamental support |
Bullish Scenario
Stable Bond Yields
        │
        ▼
Improving Liquidity
        │
        ▼
Higher Risk Appetite
        │
        ▼
Equity Market Strength
Bearish Scenario
Higher Inflation
        │
        ▼
Higher Bond Yields
        │
        ▼
Liquidity Tightens
        │
        ▼
Equity Valuation Pressure
Investor Checklist
Before increasing equity exposure, consider:
✅ Is the rally supported by earnings growth?
✅ Are institutional investors accumulating?
✅ Is market breadth improving?
✅ Are valuations reasonable?
✅ Is liquidity improving without inflation risks?
Final Thoughts
A combination of economic fundamentals, liquidity conditions, investor psychology, and policy expectations shapes markets. While regulatory changes and political developments can influence short-term sentiment, long-term market performance has historically depended on earnings growth, productivity, innovation, and business quality.
Rather than assuming any single narrative fully explains market movements, investors should monitor multiple indicators—including bond yields, liquidity, institutional flows, valuations, and corporate earnings—before concluding whether a rally is sustainable.
🔥 Top 10 High-CTR SEO Titles
- Is a Trump Rally Being Engineered? The Hidden Fed Strategy That Could Change Global Markets
- Trump Rally or Market Manipulation? Inside the Fed’s Hidden Game and the War on Short Sellers
- The Fed’s Secret Plan? How Trump’s Market Push Could Trigger the Next Global Rally
- Trump vs. Short Sellers: Is Wall Street Being Artificially Pumped Before the Elections?
- The $3 Trillion Question: Is the Fed Quietly Fueling the Next Trump Rally?
- Wall Street’s Hidden Game: Trump, the Fed, and the Battle for Market Control
- The Trump Rally Explained: Fed Liquidity, Short Sellers & the Global Market Impact
- Sell India, Buy America? How the Trump Rally Could Reshape Global Capital Flows
- Artificial Rally or Real Bull Market? Decoding Trump’s Market Strategy and Fed Liquidity
- Trump’s War on Short Sellers: The Hidden Market Strategy Every Investor Should Understand