
Introduction: Is India’s Stock Market Recovery Real or Just an IT-Led Rally?
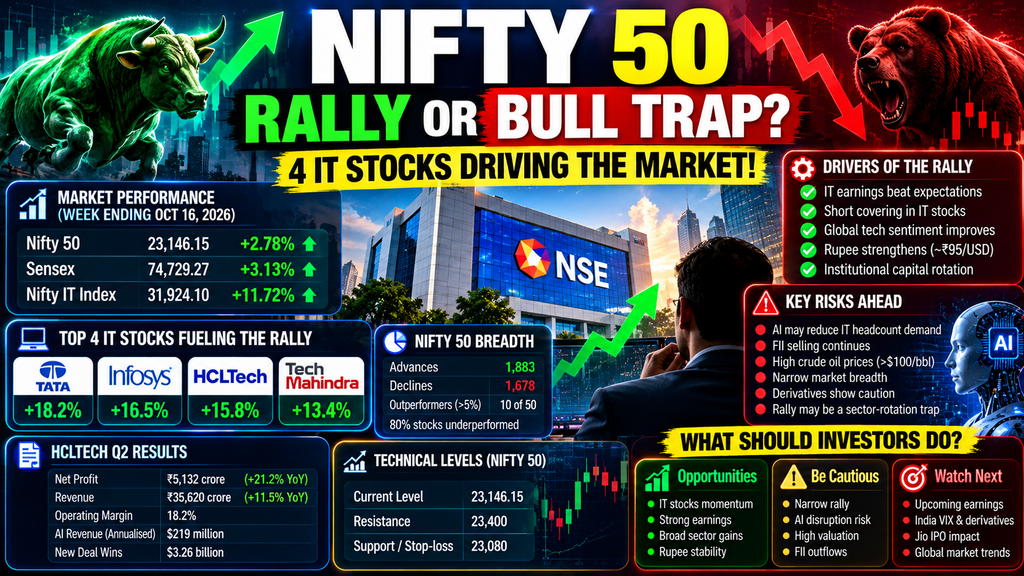
The Indian stock market staged a strong rebound during the week ended October 16, 2026, giving investors renewed hope after a period of weakness. The Nifty 50 gained approximately 2.78%, while the BSE Sensex advanced around 3.13%, marking their strongest weekly performance since April 2026.
However, the most striking development was the performance of information technology stocks. The Nifty IT index surged approximately 11.72% during the week, significantly outperforming the broader market. TCS, Infosys, HCLTech and Tech Mahindra were among the prominent beneficiaries of the rebound.
This raises an important question for investors: Is the rally the beginning of a sustainable market recovery, or is it a short-term rebound driven by concentrated sector buying?
A rising index does not always mean that the entire market is recovering. Earnings surprises, short covering, currency movements, institutional positioning and changing expectations about artificial intelligence can all move stock prices sharply.
In this analysis, we examine the latest market performance, the strength of IT earnings, AI-related risks, foreign investor activity, derivatives positioning and important technical levels to watch.
1. Nifty 50 Market Performance: Key Numbers for October 16, 2026
The latest weekly data show a strong recovery in benchmark indices, with IT stocks playing a leading role.
| Market indicator | Latest reported reading |
|---|---|
| Nifty 50 close, October 16 | 23,146.15 |
| Nifty 50 weekly gain | Approximately 2.78% |
| Sensex close, October 16 | 74,729.27 |
| Sensex weekly gain | Approximately 3.13% |
| Nifty IT weekly gain | Approximately 11.72% |
| Nifty IT close, October 16 | 31,924.10 |
| Crude oil backdrop | Above $100 per barrel in recent reporting |
Sources: Reuters, LiveMint and Angel One market updates.
The performance difference between the Nifty 50 and Nifty IT is particularly important. The IT index gained almost 9 percentage points more than the benchmark during the week.
This indicates that the recovery was unusually strong in one sector rather than equally distributed across all parts of the market.
However, the rally was not restricted to IT alone. Reuters reported gains across 12 of 16 major sectors on Friday, although small-cap stocks edged lower and mid-caps showed only modest movement.
Market takeaway: The rebound was broad enough to involve several sectors, but the exceptional performance of IT stocks remains the defining feature of the weekly move.
2. The Four IT Stocks Behind the Market Rebound
Large IT companies can have a meaningful influence on benchmark indices because of their market capitalisation and index weightings.
During the week ended October 16, TCS, Infosys, HCLTech and Tech Mahindra were among the major IT stocks contributing to positive sentiment. Reuters reported weekly gains of approximately 13.4% to 18.2% among leading IT performers. <Cite refs={[“turn553819news36”]}/>
The rally followed a combination of quarterly earnings updates, changing expectations around technology spending, and buying interest in IT stocks after a difficult period.
Why Did IT Stocks Rally So Sharply?
Several factors contributed to the recovery:
- Earnings surprises: Some results were stronger than market expectations.
- Valuation reassessment: Investors reconsidered the prices of IT stocks after significant declines earlier in 2026.
- Global technology sentiment: A sell-off in global AI-related stocks encouraged some investors to reconsider traditional IT services companies.
- Short covering and momentum: Sharp price increases can force bearish traders to reduce positions, adding to upward momentum.
- Currency movements: A stronger rupee was an important part of the broader market backdrop, although currency effects differ between companies and reporting periods.
The important distinction is that a strong share-price recovery does not automatically prove that long-term earnings growth has improved.
Investors should examine whether the rally is supported by better revenue growth, stronger deal pipelines, improved guidance and sustained cash generation.
3. HCLTech Results: Strong Profit Growth but a Cautious Outlook
HCLTech’s September-quarter results offer a useful example of why investors must examine both reported performance and future guidance.
According to Reuters’ October 12 report, HCLTech reported:
| HCLTech metric | Reported result |
|---|---|
| Quarterly net profit | ₹5,132 crore |
| Year-on-year net profit growth | 21.2% |
| Quarterly consolidated revenue | ₹35,620 crore |
| Year-on-year revenue growth | 11.5% |
| Operating margin | 18.2% |
| Advanced AI annualised revenue | $219 million |
| New deal wins | $3.26 billion |
These numbers show that HCLTech is generating meaningful revenue and profit growth. Its advanced AI revenue also indicates that AI is becoming a commercial opportunity for at least some IT services providers.
However, the company maintained a cautious outlook because of volatile demand, geopolitical uncertainty,y and AI-related pricing pressures.
This distinction matters: a company can beat earnings expectations while still facing uncertainty about future growth.
For investors, the most useful indicators to track are:
- Organic revenue growth.
- Deal wins and the speed at which contracts become revenue.
- Operating margins.
- AI-related revenue and profitability.
- Management guidance for upcoming quarters.
A strong quarterly result may support a rally, but several quarters of consistent growth would provide stronger evidence of a durable recovery.
4. Is the IT Rally a Genuine Turnaround or a Short-Covering Bounce?
A short-covering rally occurs when traders who previously sold stocks or futures buy them back to close their positions. This buying can accelerate an upward move without necessarily reflecting an equivalent improvement in long-term business fundamentals.
There are several ways to evaluate the current IT-led rally.
Signs Supporting a Sustainable Recovery
- Quarterly earnings exceed expectations.
- Companies maintain or improve their revenue guidance.
- Deal wins translate into actual revenue.
- Trading participation remains strong over several weeks.
- More sectors and market-cap segments participate in the advance.
- Institutional investors increase long exposure rather than simply closing short positions.
Signs That Would Justify Caution
- The market rises while earnings estimates continue to decline.
- Only a small group of large-cap stocks supports the benchmark.
- Price gains fail to attract sustained participation.
- Derivatives positioning remains defensive.
- Mid-cap and small-cap indices repeatedly underperform.
- Companies report higher AI-related demand but weaker pricing or profitability.
The latest market data show a powerful IT recovery, but one week of gains is not enough to establish a new long-term bull market.
The next step is to watch whether the rally survives fresh earnings announcements and whether participation broadens beyond the largest IT stocks.
5. AI Disruption: A Major Long-Term Risk for Indian IT Services
Artificial intelligence is creating opportunities for IT companies, but it is also changing how technology services are delivered and priced.
Traditional IT services businesses have often earned revenue through project contracts, employee deployment,nt and billable hours. AI coding assistants and automation tools can allow developers to complete certain tasks faster, potentially reducing the number of billable hours required.
This creates two competing effects.
The Bear Case: AI Could Compress Pricing
If clients can complete the same work with fewer developer hours, they may demand lower prices from service providers.
Potential consequences include:
- Lower revenue per project.
- Reduced demand for some traditional services.
- Pressure on employee utilisation.
- Changes to hiring requirements.
- Increased competition from AI-enabled service providers.
The risk is not that every software project can suddenly be completed by a handful of developers. Complex enterprise systems still require architecture, security, integration, testing, governance and ongoing support.
The more realistic concern is that AI may gradually reduce the labour required for selected tasks and change the pricing structure of IT contracts.
The Bull Case: AI Can Create New Revenue Opportunities
IT companies can also benefit from AI through:
- Enterprise AI implementation.
- Cloud migration and infrastructure.
- Data engineering and management.
- Cybersecurity.
- AI model integration.
- Legacy-system modernisation.
- AI governance and ongoing maintenance.
HCLTech’s reported annualised advanced AI revenue of $219 million is one example of commercial AI activity in the sector.
The key investment question is whether new AI-related revenue will grow fast enough to offset pricing pressure in traditional services.
What investors should monitor: AI-related revenue, deal wins, client spending, revenue growth, operating margins and management commentary about productivity gains.
6. Indian Rupee Recovery and RBI Intervention: Why Currency Matters
Currency movements have also influenced the market environment.
Reuters reported that the rupee strengthened during October following Reserve Bank of India measures designed to curb speculative foreign-exchange activity and reduce pressure on the currency. On October 13, the rupee reached approximately ₹95.07 per US dollar before settling near ₹95.28.
A stronger rupee can affect Indian IT companies in several ways.
Potential Benefits
- Reduced imported inflation pressure.
- Lower rupee cost for some dollar-linked expenses.
- Improved confidence if currency volatility moderates.
Potential Risks for IT Exporters
Indian IT companies receive a substantial share of their revenue from overseas clients, including clients paying in US dollars.
If the rupee strengthens, each dollar of overseas revenue converts into fewer rupees, all else being equal. This can create a headwind for reported rupee revenue and margins.
However, the final impact depends on hedging, overseas costs, contract terms and other currency exposures.
It would therefore be incorrect to assume that a stronger rupee is universally positive or negative for the Indian market.
Investors should examine currency trends alongside company-level financial results.
7. FII and DII Activity: Is Institutional Buying Supporting the Rally?
Foreign institutional investors (FIIs, also commonly called FPIs) and domestic institutional investors (DIIs) can influence market direction through their cash-market and derivatives positions.
A rally driven by sustained cash-market purchases is different from a rally driven primarily by short covering or a temporary shift in sector allocations.
To assess institutional conviction, investors should track:
- Daily FII/FPI net cash-market purchases or sales.
- DII net purchases or sales.
- Index futures open interest.
- Changes in long and short positions.
- Sector-wise fund flows.
- Performance of mid-cap and small-cap indices.
The October 16 market reporting noted that foreign investors continued to sell despite the broader weekly rebound.
This does not prove that the rally must reverse. Domestic institutions and other market participants can absorb foreign selling, and institutional flows can change rapidly.
However, persistent foreign selling combined with narrow market leadership would justify closer monitoring of the rally’s durability.
8. Derivatives Analysis: Five Signals Traders Should Watch
Spot prices alone do not provide a complete picture of market positioning. Options and futures data can help traders understand hedging demand, leverage, and positioning, although no single indicator predicts market direction reliably.
The following signals are particularly relevant during a sharp rebound.
1. Put Implied Volatility
Put options can be used to hedge against a market decline. If put implied volatility rises while the index rallies, it may indicate that demand for downside protection remains elevated.
However, this relationship is not a universal bearish signal. Implied volatility also reflects event risk, demand for specific strikes, expiry effects and market-maker positioning.
Traders should compare volatility across strikes and expiries rather than interpreting one reading in isolation.
2. India VIX
India VIX reflects the market’s implied expectation of near-term Nifty volatility derived from option prices.
If the Nifty rises while India VIX remains elevated, it can suggest that traders continue to price in uncertainty.
Conversely, a declining VIX may indicate easing demand for protection. Neither outcome guarantees the next market move.
3. Put-Call Ratio (PCR)
PCR compares put and call activity or open interest, depending on the specific calculation.
A falling PCR during a rising market can be consistent with a change in positioning, but the interpretation depends on whether the ratio is calculated using traded volume or open interest.
A PCR decline alone cannot confirm institutional distribution or an imminent market reversal.
4. Futures Premium and Cost of Carry
Index futures may trade at a premium or discount to the spot index. The difference is influenced by interest rates, dividends, time to expiry,piry and market positioning.
A narrowing futures premium can reflect changing demand for futures exposure, but it must be evaluated against fair value and expiry timing.
Traders should not interpret every reduction in premium as evidence of bearish institutional sentiment.
5. Open Interest and Price Action
Price and open interest together can help traders classify market activity:
- Rising price with rising open interest may indicate new positions being added.
- Rising price with falling open interest may indicate short covering.
- Falling price with rising open interest may indicate fresh short positions.
- Falling price with falling open interest may indicate long positions being closed.
These are common interpretations, not definitive rules. Open interest does not independently identify every trader’s intentions.
Important data note: The source analysis supplied for this article contains a snapshot of put IV, PCR, futures pr,emium and open-interest changes. Those figures should be verified against timestamped NSE data before publication or use for live trading. They should not be presented as confirmed current readings without that verification.
9. Nifty 50 Technical Analysis: Important Levels to Watch
The Nifty 50 closed at 23,146.15 on October 16, 2026.
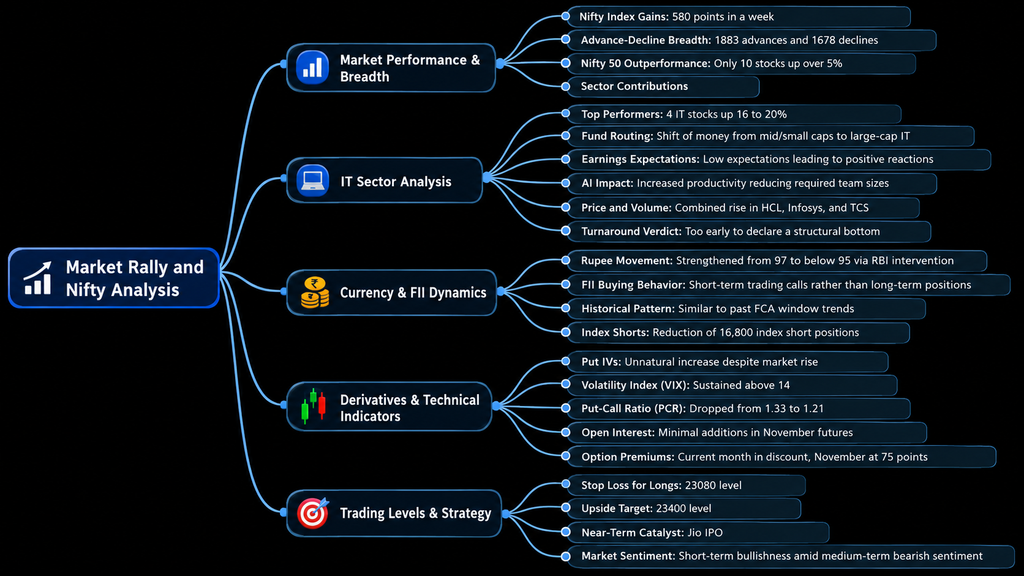
This closing level provides the starting point for the next technical assessment. The previous analysis supplied with this article identified 23,400 as a potential resistance zone and 23,080 as a proposed trailing stop-loss reference.
These are reference levels from the supplied analysis, not independently confirmed support or resistance levels. They must be reassessed using current price action, swing highs and lows, volume, volatility and the relevant trading timeframe.
| Technical reference | Level | How to interpret it |
|---|---|---|
| Latest Nifty close | 23,146.15 | Confirmed reported closing level for October 16 |
| Potential upside resistance | 23,400 | Reference zone from the supplied analysis; requires chart validation |
| Proposed trailing stop-loss reference | 23,080 | Previous analysis level; not a universal stop for every position |
| Medium-term outlook | Conditional | Depends on breadth, earnings, flows and price confirmation |
Bullish Scenario
A sustained move above a validated resistance zone, accompanied by stronger market breadth and improving institutional participation, would support the case for a more durable recovery.
Traders should look for confirmation rather than entering solely because the index is rising.
Bearish Scenario
If the Nifty fails near resistance, IT leadership weakens and market breadth deteriorates, the rebound could lose momentum.
A break below relevant swing support would warrant reassessment of bullish positions. Traders should use levels calculated from the latest chart rather than treating old references as fixed trading signals.
Range-Bound Scenario
The market may consolidate while investors wait for additional corporate earnings and macroeconomic signals. In this case, chasing a sharp move could produce an unfavourable risk-reward ratio.
10. Crude Oil, Inflation and Global Market Risks
Crude oil remains another important variable for Indian equities.
India imports a substantial amount of its oil requirements. Persistently expensive crude can increase import costs, create inflationary pressure and affect corporate margins.
Higher energy costs can also complicate monetary policy if inflation remains persistent.
For investors, the key variables to monitor are:
- Brent crude prices.
- The USD/INR exchange rate.
- Inflation and interest-rate expectations.
- Foreign portfolio flows.
- Global technology spending.
- Upcoming earnings from major banks and large-cap companies.
Reuters reported that crude oil above $100 per barrel remained a concern during the October 16 market rebound.
If crude remains elevated while the rupee weakens again, the macroeconomic environment could become more challenging for Indian equities.
On the other hand, a sustained fall in oil prices and improved earnings expectations could support a broader recovery.
11. Jio IPO: Another Event to Watch for Market Liquidity
Jio Platforms’ proposed IPO is another event investors may monitor during the coming week.
Current reporting indicates that the IPO is scheduled to open on October 21, 2026, subject to final offer documents.
A large IPO can influence investor attention and the allocation of funds between new offerings and existing listed stocks. However, its impact on overall liquidity is not predetermined.
The effect will depend on the final issue size, subscription demand, investor funding sources,s and broader market conditions.
Investors should avoid assuming that the Jio IPO will automatically trigger either a market rally or a correction.
12. Trading Strategy: How to Approach a Rally with Mixed Signals
During a strong rebound, the goal is not to predict every market move. It is to manage risk while waiting for evidence that the trend is sustainable.
For Intraday Traders
- Use the current session’s price action and volume.
- Avoid entering solely because the previous session was strongly bullish.
- Define a stop-loss before entering a trade.
- Check option liquidity, bid-ask spreads and implied volatility.
- Avoid excessive leverage when volatility is elevated.
For Swing Traders
- Prefer setups supported by price structure, volume and improving relative strength.
- Check whether the rally is broadening beyond a handful of stocks.
- Monitor earnings guidance and sector performance.
- Use position sizes appropriate to the stop-loss distance.
- Reassess positions when the original trading thesis changes.
For Long-Term Investors
- Focus on earnings growth and business fundamentals.
- Avoid treating a one-week rebound as proof that a correction is over.
- Diversify rather than concentrating exposure in the strongest-performing sector.
- Evaluate valuations and cash generation.
- Maintain an investment horizon consistent with the underlying business thesis.
No strategy can eliminate market risk, and the levels discussed in this article are not personalised investment recommendations.
13. Final Verdict: Is the Nifty Rally a Bull Trap?
The October 12–16 rebound was significant. The Nifty 50 rose approximately 2.78%, the Sensex gained around 3.13%, and the Nifty IT index surged 11.72%. Earnings-related optimism helped major IT stocks recover after a difficult period.
However, the rally still needs to pass several tests before it can be described as a durable bull-market recovery.
Bullish evidence includes:
- Better-than-expected quarterly results from some IT companies.
- A strong rebound in major IT stocks.
- Gains across several major sectors.
- Improved short-term market sentiment.
Reasons for caution include:
- Uneven participation across market-cap segments.
- Continued foreign investor selling in recent reporting.
- AI-related pricing and demand uncertainty.
- Elevated crude oil prices.
- The need for confirmation from sustained earnings growth and market breadth.
The most balanced conclusion is that the rally is a meaningful recovery in prices, but its long-term sustainability remains uncertain.
Calling it a confirmed bull trap would be premature. Declaring a new bull market based on one strong week would be equally premature.
Investors should follow earnings revisions, sector breadth, institutional flows, crude oil, currency movements and properly timestamped derivatives data before increasing risk.
Frequently Asked Questions
Why did the Nifty 50 rise during the week ended October 16, 2026?
The rebound was led by IT stocks following quarterly earnings updates and changing investor expectations around technology companies. The Nifty gained approximately 2.78% during the week.
How much did the Nifty IT index gain?
The Nifty IT index rose approximately 11.72% during the week ended October 16, 2026, closing at 31,924.10.
Does a rising Nifty with weak market breadth indicate a bull trap?
Not necessarily. Narrow participation can increase the risk that a rally will struggle to sustain itself, but a bull trap can only be assessed with subsequent price action and broader evidence.
How does AI affect Indian IT stocks?
AI can create new revenue opportunities in cloud, integration and automation while putting pressure on traditional billable-hour models and pricing. The net impact will vary by company.
What should traders monitor next?
Traders should monitor Nifty price structure, sector breadth, quarterly earnings, FII/FPI and DII flows, India VIX, options positioning, crude oil and the rupee.
Disclaimer
This article is for educational and informational purposes only and does not constitute investment advice. Market data and company results are subject to revision. Technical levels are illustrative and must be validated against current charts. Derivatives indicators can be misinterpreted when viewed in isolation. Consult a SEBI-registered investment adviser before making investment decisions.
Top 10 SEO Titles
- Nifty 50 Rally or Bull Trap? 4 IT Stocks Driving the Market
- Nifty 50 Analysis Today: Is the Market Rally Sustainable?
- Indian Stock Market Outlook: Nifty Rally, IT Stocks & AI Risks
- Nifty IT Index Surges 11.7%: Is This a Real Market Recovery?
- Nifty 50 Bull Trap Warning? 5 Signals Every Investor Should Watch
- Why IT Stocks Are Rising: TCS, Infosys, HCLTech & Tech Mahindra
- Nifty 50 Market Analysis: FII Selling, AI Risks & Key Levels
- Stock Market Rally Explained: Is Nifty 50 Ready for Another Fall?
- Nifty 50 Prediction: IT Rally, India VIX & Derivatives Signals
- Indian Stock Market October 2026: Bullish Reversal or Bull Trap?