

Introduction: Is the AI Boom Creating the Next Financial Market Crisis?
Artificial intelligence has become one of the biggest investment themes in global financial markets. Technology companies are committing hundreds of billions of dollars to data centres, advanced semiconductors, cloud computing and AI infrastructure. Investors are betting that these investments will transform productivity, create new revenue streams and support years of corporate earnings growth.
But a critical question is emerging: Are AI-related investments creating sustainable economic value, or are rising valuations and debt-financed spending increasing the risk of a major market correction?
Two historical events offer important comparisons.
The 2000 dot-com crash was driven by excessive valuations, speculative investment and unrealistic expectations about the commercial potential of internet businesses. The 2008 global financial crisis, by contrast, involved excessive leverage, deteriorating credit quality, interconnected financial institutions and a collapse in confidence across the credit system.
The current AI investment cycle has elements that resemble both periods, but it is not identical to either one. Today’s largest technology companies generate substantial revenue and profits, while the rapid expansion of AI infrastructure is raising questions about capital expenditure, free cash flow and financing risk.
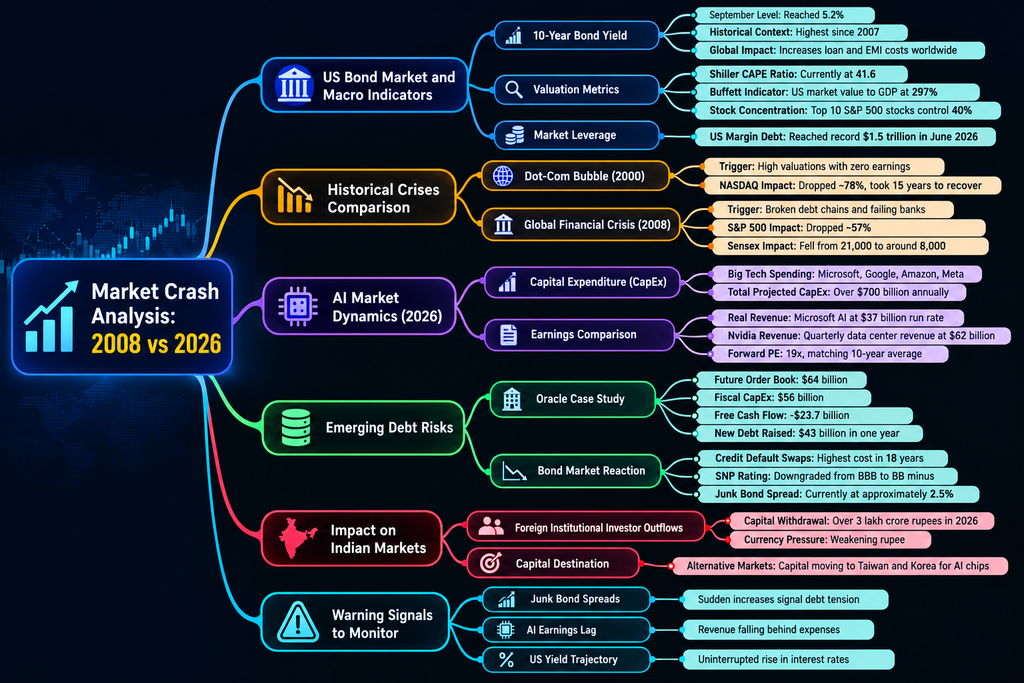
Moody’s estimated that capital expenditure by six major US technology and AI infrastructure companies could reach approximately $700 billion in 2026. Separately, Reuters has warned that rising AI investment could put pressure on the free cash flow of major technology companies.
For investors in India, these developments matter because global interest rates, foreign portfolio flows, currency movements and technology-sector valuations can influence Indian equities.
This article examines five uncomfortable truths about the AI boom, the risks investors should monitor, and why a correction is possible without a financial crisis being inevitable.
1. Stock Market Valuations Are Elevated—but High Valuations Alone Do Not Predict a Crash
Several valuation indicators suggest that US equities are expensive relative to historical measures. However, investors must distinguish between an expensive market and an imminent market collapse.
Shiller CAPE Ratio: Around 40.7
The Shiller cyclically adjusted price-to-earnings ratio, or CAPE, compares stock prices with inflation-adjusted average earnings over approximately ten years.
Available October 2026 data put the US CAPE ratio at approximately 40.7. This is an elevated reading by historical standards and indicates that investors are paying a substantial price relative to long-term earnings.
A high CAPE ratio can mean that future returns may be more sensitive to disappointing earnings or changes in interest rates. However, CAPE is not a timing indicator: it cannot tell investors when a correction will begin or how severe it might become.
Buffett Indicator: Approximately 233%
The Buffett Indicator compares the total value of the US stock market with US economic output.
Available data through October 16, 2026, put the indicator at approximately 233%, placing it well above its historical norms.
This suggests that the market’s total value is large relative to the annual output of the economy. However, the measure has limitations. US-listed companies generate revenue globally, and changes in the composition of listed companies can affect the relationship between market capitalisation and domestic GDP.
The indicator should therefore be used as a broad valuation measure rather than a precise crash forecast.
Market Concentration: The Mega-Cap Technology Risk
A further concern is concentration in a relatively small number of large companies.
When a handful of technology businesses account for a substantial share of an index’s market value, index performance becomes increasingly dependent on their earnings, valuations and investment plans.
If those companies deliver strong earnings, concentration can support the market. If expectations deteriorate simultaneously, the same concentration can amplify declines.
Investors should examine the weight of the largest holdings in their portfolios, particularly when using market-cap-weighted index funds.
US Margin Debt: A Potential Source of Volatility
US margin debt also deserves attention because borrowed money can amplify both gains and losses.
Barron’s reported that US margin debt reached approximately $1.48 trillion in September 2026, the second-highest level on record. However, margin debt relative to the S&P 500’s market capitalisation was approximately 2.2%, below certain historical peaks.
This is an important qualification: a large nominal margin-debt figure does not, by itself, establish that a systemic crisis is approaching.
The risk increases when leveraged positions are combined with falling asset prices, tighter lending conditions and forced selling.
Investor takeaway: High valuations and rising leverage make markets more sensitive to bad news, but neither indicator can independently predict the timing of a crash.
2. Why the Current AI Boom Is Different From the Dot-Com Bubble of 2000
The dot-com crash remains one of the clearest examples of what can happen when investors pay extreme prices for businesses whose commercial prospects fail to meet expectations.
The Nasdaq Composite fell approximately 78% from its 2000 peak to its 2002 low. Many internet businesses struggled to generate sustainable revenue, profits, or cash flow.
Today’s AI investment cycle has a different foundation in one important respect: many of the companies funding AI infrastructure are already established, profitable businesses.
AI Has Real Commercial Demand
AI is being integrated into cloud computing, software development, enterprise automation, search, cybersecurity, customer service,e and data analytics.
Major technology companies are investing because they expect demand for computing power and AI services to continue expanding.
The current cycle therefore cannot simply be dismissed as a repeat of 2000. AI has practical commercial applications, and some businesses are already generating substantial revenue from related services.
The Spending Cycle Is Still Risky
The existence of genuine demand does not guarantee that every AI investment will earn an attractive return.
Companies can overestimate future demand, build too much capacity, underestimate operating costs, ts or pay too much for infrastructure.
Even when revenue grows, profits and free cash flow may disappoint if the cost of generating that revenue rises faster.
The most important question is not whether AI is useful. It is whether the revenue and productivity gains generated by AI will justify the enormous investments being made today.
AI Capital Expenditure: Approximately $700 Billion in 2026
Moody’s estimated that capital expenditure by six major US technology and AI infrastructure companies could reach around $700 billion in 2026, nearly six times the level reported for 2022 in its analysis.
Such spending includes infrastructure required to support data centres and growing computing demand. It also creates obligations relating to electricity, cooling, networking, hardware replacement and financing.
The potential problem is a mismatch between the timing of investment and the timing of returns.
If AI revenue grows rapidly and remains profitable, the investment cycle may prove economically productive. If monetisation disappoints, investors could reassess the valuations of both technology companies and their infrastructure suppliers.
The key distinction: A real technological revolution can still produce an investment bubble if investors overestimate future profits or pay too much for growth.
3. Oracle: A Case Study in AI Spending, Debt and Free Cash Flow
Oracle illustrates why investors need to examine cash generation and financing alongside revenue growth.
The company has been expanding its cloud infrastructure business to meet demand for AI computing. Large future customer commitments can support revenue visibility, but fulfilling those commitments requires significant investment.
Reuters reported in July 2026 that rising AI infrastructure spending was putting pressure on the free cash flow of major technology companies. Its analysis suggested that the combined capital expenditure of Microsoft, Alphabet, Amazon, Meta Platforms and Oracle could exceed their combined free cash flow by 2027.
Why Backlog Is Not the Same as Cash
A company’s contracted future business can look impressive, but it does not mean the entire amount is immediately available as cash.
A cloud provider may need to build data centres, purchase equipment, secure power capacity and pay operating expenses before it can deliver services and collect revenue.
The timing of customer payments and infrastructure expenditure therefore matters.
Investors should ask:
- How much of the reported backlog is likely to become revenue?
- How much capital expenditure is required to fulfil the contracts?
- What operating margin will those contracts generate?
- How much cash will remain after interest and infrastructure spending?
- Will the company need to borrow more to fund expansion?
Understanding Free Cash Flow
Free cash flow is generally calculated as operating cash flow minus capital expenditure.
A company can report growing revenue and positive accounting earnings while generating negative free cash flow if investment spending is sufficiently large.
Negative free cash flow is not automatically a sign of financial distress. It may be reasonable for a growing company that is investing in profitable future capacity.
The concern arises when capital expenditure remains high while returns fall short, debt increases,ses and financing costs rise.
Debt and Interest Expense
Borrowing can help companies expand quickly, but it introduces fixed obligations.
When debt rises, investors need to monitor interest coverage, debt maturities, credit ratings, and the company’s ability to fund operations without continuously accessing capital markets.
Credit-rating changes and credit-default-swap prices can provide additional information about perceived risk. However, neither is a perfect prediction of default.
Claims about Oracle’s exact debt issuance, free cash flow, credit rating and credit-default-swap records should be checked against the relevant company filings and rating-agency announcements before being repeated as definitive figures.
Investor takeaway: The issue is not that Oracle or the AI sector is necessarily heading for insolvency. It is whether the cash generated by future AI services will justify the infrastructure investment and financing costs.
4. The Bond Market: Why US Treasury Yields Matter for Global Stocks
Interest rates are one of the most important links between global bond markets and equity valuations.
The US Treasury market influences the returns investors can obtain from relatively low-credit-risk dollar assets. When Treasury yields rise, investors may demand higher expected returns from equities and other risky investments.
That can put pressure on valuations even when corporate earnings remain positive.
US 10-Year Treasury Yield Near 5.2%
US Treasury yields moved above 5% in October 2026. Recent market reporting placed the 10-year yield around 5.1%–5.2%, although the level changes daily.
Higher yields can affect markets through several channels:
- Valuation pressure: Future corporate earnings are discounted at a higher rate.
- Borrowing costs: Companies refinancing debt may face more expensive financing.
- Portfolio allocation: Some investors may prefer higher bond yields over riskier equities.
- Currency effects: Interest-rate differentials can influence exchange rates and capital flows.
- Emerging-market pressure: Higher US yields can make dollar assets relatively more attractive.
The effect is not automatic. Equity markets may continue rising when earnings growth is strong enough to offset higher discount rates.
Did the Federal Reserve Raise Rates in September 2026?
The original draft attributes the rise in Treasury yields to a September Federal Reserve rate hike. That claim should not be used as written.
A Reuters poll published on October 20, 2026, reported that economists expected the Federal Reserve to hold its benchmark rate at 3.75%–4.00% at the October meeting, with many expecting a possible increase in December.
This illustrates why it is important to distinguish between a change in the policy rate and a change in longer-term Treasury yields. Bond yields can rise because of inflation expectations, government borrowing, term premiums and expectations about future monetary policy—even when the central bank has not raised rates in that month.
What Should Indian Investors Watch?
For Indian investors, a sustained rise in US yields could affect foreign portfolio flows, the rupee, domestic borrowing conditions and the valuation of growth stocks.
However, capital flows depend on several variables, including India’s earnings outlook, domestic interest rates, currency expectations and global risk appetite.
Claims that FIIs withdrew a particular amount from Indian equities should be supported by dated exchange or depository data. Broad assertions about capital flight should not substitute for verified net-flow figures.
5. The 2008 Comparison: Could AI Investment Become a Debt Crisis?
The 2008 global financial crisis involved more than expensive assets. It was a systemic credit event in which leverage, poor lending standards, complex financial products and falling property prices contributed to widespread financial stress.
The AI investment cycle has different characteristics, but it raises questions about the financing of infrastructure and the relationships between technology companies, lenders and data-centre operators.
How Debt Can Amplify an AI Downturn
Consider a simplified sequence:
- Companies invest heavily in AI infrastructure.
- Some investments are financed with borrowing or long-term contractual commitments.
- AI revenue grows more slowly than expected.
- Cash flow falls short of investment and debt-service requirements.
- Credit spreads widen, and refinancing becomes more expensive.
- Companies delay projects or reduce spending.
- Suppliers and infrastructure operators experience lower demand.
- Investors reassess valuations across the technology sector.
This is a risk scenario, not a prediction that these events will necessarily occur.
The danger would be greater if financing structures were opaque, companies depended heavily on refinancing, or multiple counterparties relied on the same optimistic AI demand forecasts.
The Importance of Hidden and Indirect Obligations
Debt is not always limited to the borrowing figure displayed prominently on a balance sheet.
Investors may also need to consider lease liabilities, guarantees, project-financing structures, long-term purchase commitments and obligations associated with special-purpose entities.
These items are not automatically undisclosed or improper. Their importance depends on the contractual terms, accounting treatment and the extent to which risks are transparent in public filings.
Reuters reported on October 19, 2026, that S&P Global had warned major technology companies could have more AI-related debt exposure than is readily visible through traditional disclosures, particularly through interconnected financing arrangements. The agency said the financial consequences depend in part on whether expected AI profits materialise.
This is a reason to scrutinise financing arrangements, not proof that a systemic debt crisis has already begun.
Why the Current Situation Is Not Automatically 2008
The largest AI companies have substantial operating businesses, significant customers and diversified sources of revenue.
A decline in AI valuations would not automatically produce the same chain of events as the collapse of the US mortgage market.
For a wider financial crisis to emerge, the shock would likely need to spread through leverage, credit losses, refinancing difficulties or interconnected financial exposures.
The distinction: AI investment may experience a severe correction without causing a banking crisis. The risk becomes more serious if losses are amplified by opaque leverage and widespread dependence on refinancing.
6. Junk Bond Spreads: A Critical Warning Signal
High-yield credit spreads measure the additional yield investors demand to hold lower-rated corporate bonds rather than comparable US Treasury securities.
They are useful because they reflect how much compensation investors require for credit risk and uncertainty.
When spreads widen sharply, it can indicate that investors are becoming more concerned about default risk, refinancing conditions, ns or the broader economic outlook.
When spreads remain relatively narrow, credit markets are generally pricing in more limited near-term default risk.
However, spreads can remain low for long periods before changing rapidly. They are not a guaranteed early-warning indicator.
Three Credit-Market Signals to Monitor
1. Rapid widening in high-yield spreads
A sharp increase would indicate that lenders are demanding more compensation for taking corporate credit risk. Investors should examine whether the move is concentrated in a few issuers or is broadening across the market.
2. Deteriorating free cash flow
If AI infrastructure expenditure continues increasing while operating cash flow fails to keep pace, some companies may have to borrow more, reduce shareholder returns, or delay projects.
3. Rising refinancing costs
Companies with large upcoming debt maturities are more vulnerable when financing becomes expensive, or credit markets become less willing to lend.
The original draft cites approximately 2.5% for junk-bond spreads today and around 20% during the dot-com crash. These figures should not be compared without specifying the exact spread index, date, and methodology. Different high-yield spread measures can produce different readings.
7. Three AI Bubble Warning Signs Investors Should Watch Next
No single indicator can establish that a bubble is about to burst. A combination of deteriorating financial performance, tightening credit, and weakening market participation would provide stronger evidence of increasing risk.
Warning Sign 1: AI Revenue Fails to Match Capital Spending
AI investment can create substantial economic value, but companies ultimately need to earn a return on that capital.
Investors should compare:
- Capital expenditure growth.
- AI-related revenue growth.
- Operating profit and margins.
- Free cash flow.
- Return on invested capital.
- Customer retention and actual usage.
If spending rises rapidly but revenue and cash flow disappoint, the market may reassess expected future returns.
Warning Sign 2: Corporate Credit Risk Increases
Watch for widening credit spreads, deteriorating ratings, weaker interest coverage and growing reliance on refinancing.
A single downgrade or a temporary rise in borrowing costs is not enough to confirm a crisis. The broader pattern matters.
Warning Sign 3: Treasury Yields Rise While Earnings Expectations Weaken
This combination can create a double challenge for equities.
Higher yields reduce the present value of future earnings, while weaker earnings forecasts reduce the cash flows investors expect to receive.
Growth stocks with valuations heavily dependent on future profits can be particularly sensitive to this combination.
A market decline becomes more concerning if these pressures coincide with falling liquidity and rising forced selling.
8. What Could Happen to the Indian Stock Market?
Indian equities are influenced by domestic earnings, economic growth, interest rates, investor flows, and global financial conditions.
A sharp correction in global technology stocks could affect Indian markets through several channels.
FII and FPI Flows
Foreign portfolio investors may reduce emerging-market exposure when global risk appetite deteriorates or dollar assets become more attractive.
However, foreign selling does not guarantee an Indian market crash. Domestic institutional investors, retail investors, and changes in earnings expectations can influence the market in different directions.
Indian IT Companies
A global AI correction could affect Indian IT services companies if customers reduce technology budgets or delay projects.
There is also a more complex possibility: companies could increase spending on AI implementation while negotiating lower prices for traditional software development work.
The outcome will depend on how successfully Indian IT companies shift toward higher-value services and capture the productivity benefits of AI.
The Rupee and Imported Inflation
A weaker rupee can raise the cost of imported commodities and other dollar-priced items, while a stronger rupee can reduce some import costs.
For exporters, currency movements affect the rupee value of overseas revenue. The final impact depends on hedging, overseas expenses, and contract structures.
Domestic Earnings and Valuations
Even if global markets correct, India’s domestic economy and company earnings will remain important.
Investors should assess individual businesses on their earnings growth, balance sheets, valuation and ability to generate cash rather than assuming that every Indian stock will move in line with US technology shares.
9. Portfolio Strategy: How Investors Can Prepare Without Panic
The possibility of a market correction does not mean investors should automatically sell all their holdings.
A better approach is to examine the risks within a portfolio and make decisions consistent with the investor’s time horizon.
Reduce Unintended Concentration
Investors should identify whether their portfolios depend excessively on a handful of large technology companies, a single sector or one investment theme.
Diversification can reduce the impact of a problem in one company or industry, although it cannot eliminate market-wide risk.
Review Balance Sheets
Companies with strong operating cash flow, manageable debt and healthy interest coverage generally have more flexibility during difficult market conditions.
Investors should be particularly careful when a company’s valuation depends on rapid growth while its investment programme relies heavily on additional borrowing.
Understand the Difference Between Volatility and Permanent Loss
A market correction is a decline in asset prices. A permanent loss can arise when a business’s long-term earning power deteriorates, debt becomes unmanageable, or an investor is forced to sell at an unfavourable time.
The two are not the same.
Avoid Making Decisions From One Indicator
High CAPE, elevated margin debt, rising Treasury yields or a widening credit spread can each provide useful information. None can reliably predict the exact timing of a crash on its own.
Investors should look for confirmation across earnings, valuations, cash flow, credit conditions and market behaviour.
Do Not Treat a Theme as a Guaranteed Winner
AI may transform the economy, but not every company investing in AI will earn superior returns. Some suppliers may benefit, some users may become more productive,e and some business models may face pricing pressure.
The investment outcome depends on the price paid and the profits ultimately generated.
10. AI Boom 2026: Three Possible Market Scenarios
| Scenario | What could happen | What investors should monitor |
|---|---|---|
| Bull case | AI revenue grows rapidly and investment earns attractive returns | Revenue growth, cash flow and return on invested capital |
| Base case | AI demand remains strong, but spending pressures margins and valuations | Capital expenditure, operating margins and earnings guidance |
| Bear case | Monetisation disappoints, credit conditions tighten and valuations fall | Credit spreads, debt maturities, refinancing costs and falling earnings estimates |
These are illustrative scenarios rather than predictions or probability-weighted forecasts.
The bear case would become more concerning if several warning signals appeared together. The bull case would become more credible if AI revenue and productivity gains consistently translated into sustainable free cash flow.
Final Verdict: A Correction Risk Is Real, but a 2000 or 2008 Repeat Is Not Inevitable
The AI investment boom is creating genuine technological opportunities while increasing the scale of capital expenditure and financing commitments across the technology sector.
Elevated valuations mean that investors may be more sensitive to disappointing earnings. Rising infrastructure expenditure can reduce free cash flow, and higher Treasury yields can put pressure on the valuation of future profits.
At the same time, the largest AI companies are not simply speculative businesses without customers. Many have substantial revenue, established operations and significant financial resources.
The most useful comparison is therefore not to declare that the next dot-com crash or global financial crisis is certain. It is to identify which parts of the market are vulnerable if expectations, cash flow or credit conditions deteriorate.
The three most important signals are:
- AI monetisation: Are revenues and profits growing fast enough to justify the investment?
- Corporate credit: Are debt, refinancing costs and credit spreads deteriorating?
- Global interest rates: Are higher yields making equity valuations and corporate financing less sustainable?
If these indicators remain healthy, the AI boom may continue despite periods of volatility. If they deteriorate together, a significant market correction becomes a more credible risk.
For investors, the objective should be to build a resilient portfolio based on valuation, cash generation, manageable leverage and diversification—not to predict a crash from a single headline.
Frequently Asked Questions
Is the AI boom a bubble in 2026?
There are signs of elevated valuations and exceptionally high investment spending, but that does not prove that the entire AI sector is a bubble. The outcome depends on whether future earnings and cash flow justify current investment levels.
Could the AI boom cause a stock market crash?
A correction is possible if earnings disappoint, financing costs rise, or investors reassess valuations. A broader crash would depend on the scale of the shock and whether it spreads through credit markets and the financial system.
How is the AI boom different from the dot-com crash?
Many leading AI companies already generate substantial revenue and profits, unlike numerous speculative businesses during the dot-com era. However, even profitable companies can become overvalued if their future growth expectations are too optimistic.
Why is Oracle relevant to the AI debt discussion?
Oracle’s cloud expansion illustrates how large infrastructure commitments can require substantial capital expenditure and financing. Investors should examine its cash flow, debt obligations and ability to earn returns on the infrastructure it builds.
How do US Treasury yields affect Indian stocks?
Higher US Treasury yields can make dollar assets relatively more attractive, increase discount rates used to value equities and influence foreign portfolio flows. The actual impact depends on domestic earnings, currency conditions and global risk appetite.
What are the most important warning signs of an AI correction?
The most useful signals include slower AI revenue growth relative to capital expenditure, deteriorating free cash flow, rising corporate credit spreads, higher refinancing costs and weakening earnings expectations.
Disclaimer
This article is for educational and informational purposes only and does not constitute investment advice. Market indicators and financial figures can change, and valuation measures have limitations. Historical comparisons do not guarantee future outcomes. Investors should verify company disclosures and market data from primary sources and consult a SEBI-registered investment adviser before making investment decisions.
Top 10 SEO titles
AI Bubble 2026: Is a Stock Market Crash Coming?
AI Bubble vs Dot-Com Crash: Are We Repeating History in 2026?
Stock Market Crash 2026: 5 Warning Signs Investors Should Watch
AI Stock Market Bubble 2026: Is It Bigger Than the Dot-Com Crash?
AI Bubble or 2008 Financial Crisis? What Investors Need to Know
Is the AI Boom Ending? Valuations, Debt and Market Crash Risks in 2026
AI Stocks Overvalued in 2026? Warning Signs Every Investor Should Know
US Stock Market Crash 2026: How AI Spending and Rising Debt Could Affect Markets
AI Bubble 2026 Explained: CAPE Ratio, Market Valuations and Debt Risks
Will the AI Bubble Burst in 2026? Impact on US and Indian Stock Markets