

Introduction: Why Did the Market Rally Lose Momentum?
India’s stock market delivered a powerful reminder on October 14, 2026: positive headlines do not always translate into a sustained bull market.
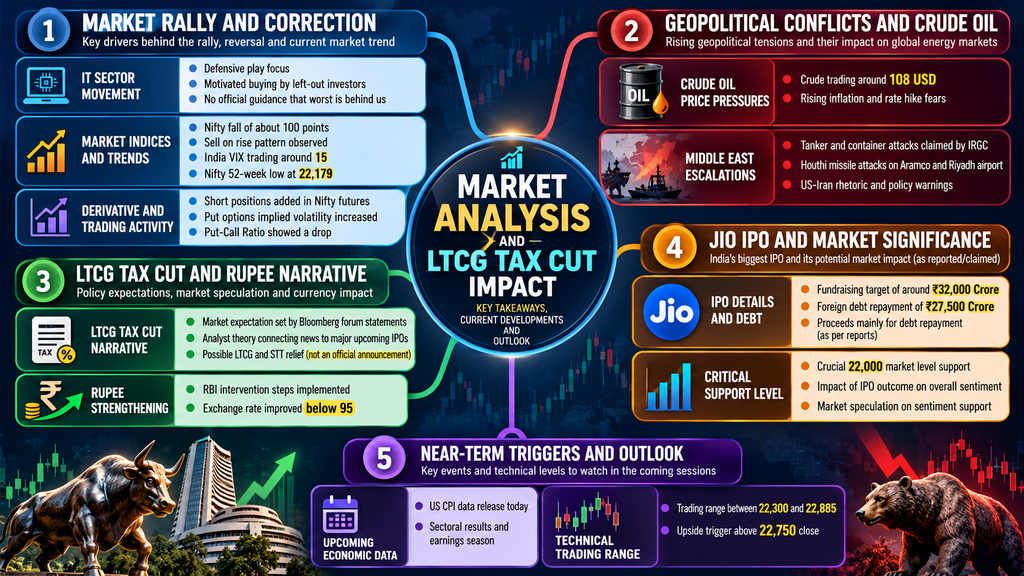
After a strong rally on Tuesday, October 13, the Nifty 50 and Sensex reversed direction on Wednesday as rising crude oil prices, persistent foreign investor selling, and geopolitical uncertainty weighed on investor sentiment. Information technology stocks provided some support, but buying in select sectors was not enough to prevent the broader market from closing lower.
The central question for investors is straightforward: Can policy optimism and strong domestic economic growth overcome rising oil prices and global financial uncertainty?
Three developments deserve particular attention:
- Expectations of possible Long-Term Capital Gains (LTCG) tax and Securities Transaction Tax (STT) relief.
- The upcoming Jio Platforms IPO is expected to be India’s largest.
- Crude oil prices rising above $106 per barrel amid geopolitical tensions.
These developments are connected through market sentiment, corporate financing, inflation expectations, and foreign capital flows. However, their simultaneous occurrence does not prove that market movements are being deliberately engineered.
Let’s examine five critical lessons investors should understand before making their next trading or investment decision.
1. LTCG Tax Relief: A Genuine Policy Possibility or a Market Sentiment Trade?
Tax policy can significantly influence investor behaviour, especially when markets are experiencing heavy selling pressure.
On October 13, Indian equities rallied after Finance Minister Nirmala Sitharaman’s comments about discussions concerning LTCG taxation and STT encouraged expectations of potential relief. The Nifty gained approximately 1.6% during that session, according to contemporary market reports.
However, discussing a tax structure is not the same as announcing a tax reduction. No confirmed LTCG or STT rate change was established by the remarks cited in these reports.
What are LTCG and STT?
Long-Term Capital Gains tax applies to eligible profits from investments held for a specified period. The Securities Transaction Tax is a transaction-based tax levied on specified securities market trades.
Under the existing framework for eligible listed equity shares and equity-oriented mutual funds, the LTCG tax rate is 12.5% on qualifying gains exceeding the annual exemption of ₹1.25 lakh, subject to applicable conditions. STT is separate and depends on the transaction type.
| Tax-related factor | Why it matters |
|---|---|
| LTCG tax | Influences the after-tax return from long-term equity investments |
| STT | Adds to the transaction costs of specified securities trades |
| Potential tax relief | Could improve investor sentiment if officially announced |
| No confirmed change | Means investors should continue using the existing rules |
Why can a rumour move the market?
Stock prices reflect expectations about future profits, capital flows and investment returns. When investors anticipate lower taxes, they may increase exposure to equities before any policy change becomes effective.
That creates a potential short-term trading opportunity, but it also creates risk.
If the expected announcement fails to materialise, traders may unwind positions, causing the rally to reverse. If crude oil prices rise simultaneously, the negative macroeconomic impact can overwhelm the initial optimism.
Investor takeaway: Treat LTCG tax relief as a potential catalyst, not a confirmed policy outcome. Base investment decisions on official announcements rather than social media speculation or interpretations of political statements.
2. Jio IPO 2026: A Historic Listing, but Does It Explain Market Support?
The upcoming Jio Platforms IPO is an important event for India’s capital markets.
According to Reuters’ October 14 report, the offering is scheduled to open on October 21, 2026. The reported price band is ₹1,065–₹1,119 per share, with approximately 27 crore shares on offer. At the upper end of the price band, the issue is expected to raise around ₹30,213 crore, subject to final offer details. The implied company valuation is approximately ₹10.3 lakh crore.
Key Jio IPO figures
| Parameter | Reported details |
|---|---|
| IPO opening date | October 21, 2026 |
| Price band | ₹1,065–₹1,119 |
| Shares offered | Up to 27 crore |
| Approximate issue size at the upper price | ₹30,213 crore |
| Approximate implied valuation | ₹10.3 lakh crore |
| Reported use of proceeds | Repayment of borrowings by Reliance Jio Infocomm |
The reported prospectus information indicates that proceeds will largely be used to repay borrowings of Reliance Jio Infocomm, with up to ₹27,500 crore allocated for this purpose. This is a substantial corporate financing transaction.
Could the IPO influence market sentiment?
A major IPO can influence the market through several channels:
- Liquidity: Investors may rearrange portfolios to finance IPO applications.
- Valuation sentiment: A successful offering can strengthen perceptions of demand for large Indian businesses.
- Parent-company exposure: Investors may reassess the valuation of related listed companies.
- Foreign participation: The offering may attract international institutional attention.
However, the IPO’s size does not establish that authorities or institutions are deliberately supporting the Nifty at a specific level. Such a claim would require direct evidence.
Similarly, a stronger rupee can reduce the rupee cost of servicing dollar-denominated liabilities, all else being equal. But the actual savings depend on debt denomination, repayment dates, hedging arrangements, exchange rates and other contractual terms.
For example, a hypothetical $1 billion unhedged liability would cost ₹9,500 crore at ₹95 per dollar and ₹9,700 crore at ₹97 per dollar—a difference of ₹200 crore. This illustrates the exchange-rate mechanism, not a verified saving attributable to Jio’s IPO.
Investor takeaway: Analyse the Jio IPO using its offer documents, valuation, business performance, debt structure and investor demand. Do not assume that the Nifty must rise or remain above a particular level because a large IPO is approaching.
3. Crude Oil at $106: Why Global Energy Prices Can Overpower India’s GDP Growth
India’s economic growth remains strong, but rising oil prices present a significant macroeconomic challenge.
The Ministry of Statistics and Programme Implementation reported that real GDP grew by 7.8% year-on-year in the first quarter of FY2026–27, covering April–June 2026. Real GDP was estimated at ₹81.36 lakh crore, compared with ₹75.46 lakh crore in the corresponding quarter a year earlier. Nominal GDP growth was 10.3%.
These figures demonstrate strong economic momentum. They do not, however, eliminate the risks associated with an external energy-price shock.
Why rising crude oil prices matter
India imports a substantial proportion of its crude oil requirements. When international oil prices rise sharply, the effects can spread across the economy.
1. Higher import expenditure
If the quantity imported remains unchanged, higher oil prices increase the dollar value of India’s energy import bill.
2. Pressure on the rupee
A larger dollar requirement for energy imports can add pressure to the currency, although the actual exchange-rate impact also depends on capital flows, central-bank operations and broader dollar movements.
3. Inflation risk
Higher energy and transportation costs can feed into logistics, manufacturing and consumer prices. The extent of the pass-through depends on domestic fuel pricing, taxes and government policy.
4. Corporate margin pressure
Airlines, paints, chemicals, logistics, tyre manufacturers and other energy-sensitive businesses may face higher costs. Companies with pricing power or effective hedging may be better positioned to manage the impact.
5. Interest-rate uncertainty
If higher energy costs lead to persistent inflation, expectations for monetary easing may weaken. Higher expected interest rates can put pressure on valuations, particularly for companies whose valuations depend heavily on future earnings.
Which sectors could benefit or suffer?
| Sector | Potential effect of sustained high crude prices |
|---|---|
| Airlines | Higher aviation fuel costs may reduce margins |
| Paints and chemicals | Input costs may rise |
| Logistics and transportation | Fuel expenses may increase |
| Oil marketing companies | Marketing margins can come under pressure, depending on pricing and policy |
| Upstream oil producers | Higher realisations may support revenue, depending on production and fiscal terms |
| Information technology | Direct oil sensitivity is generally lower, but global demand and valuation risks remain.n |
| Consumer companies | Higher packaging, freight and input costs may affect margins |
These are potential directional effects, not guaranteed share-price outcomes.
Why 7.8% GDP growth is not enough on its own
GDP growth measures economic activity over a period. Equity markets also price in future earnings, financing costs, currency movements and global risk appetite.
An economy can grow rapidly while its stock market declines if investors expect corporate earnings to weaken or demand a higher return for taking risk.
Investor takeaway: Watch the duration of the oil-price shock, not just a single day’s quotation. A brief spike may be manageable; persistently elevated prices are more likely to affect inflation, margins and market valuations.
4. FII Selling, Market Volatility and the Difference Between a Bounce and a Trend Reversal
One of the most important questions in a volatile market is whether a rally reflects durable institutional buying or a temporary recovery driven by short covering and tactical positioning.
On October 14, the Nifty 50 closed at 22,622.70, down 99.25 points or 0.44%. The Sensex closed at 72,781.89, down 251.89 points or 0.34%. The Nifty traded between 22,558.95 and 22,757.95 during the session.
The reversal followed Tuesday’s rally and reflected concerns about oil prices, foreign capital outflows and upcoming US inflation data.
What should investors monitor?
Foreign institutional investor flows: Persistent net selling can create an additional supply of shares in the market. Nevertheless, FII selling does not automatically mean that every stock or index must fall; domestic institutional buying, earnings growth and valuations can offset some of the pressure.
India VIX: The volatility index reflects the market’s expectation of near-term Nifty volatility derived from options prices. A rising VIX generally signals increased uncertainty, but it does not independently predict whether the market will rise or fall.
Futures open interest: Rising futures open interest alongside falling prices can be consistent with fresh short positions, but it can also reflect hedging or other strategies. Price, open interest and participant positioning must be analysed together.
Put-call ratio: PCR is useful as a contextual indicator, but its interpretation depends on whether it measures open interest or trading volume, which contracts are included and how positions are changing.
Futures premium: A shrinking futures premium may reflect weaker bullish demand, changing financing expectations, or shifts in market positioning. It is not conclusive evidence of institutional bearishness by itself.
Why one green session does not confirm a bull market
Consider a simplified example:
- Day 1: The Nifty rises on positive policy expectations.
- Day 2: Crude oil rises,s and the index falls.
- Day 3: The index rebounds, but market breadth remains weak.
In this scenario, the rebound alone would not confirm a sustainable trend reversal. Investors would need to see follow-through buying, stronger market breadth, improving institutional flows and a convincing recovery above relevant resistance levels.
Investor takeaway: Distinguish between short covering, tactical buying and sustained accumulation. Confirm the trend using multiple independent indicators rather than relying on a single derivative metric.
5. Nifty 50 Technical Analysis: Key Support and Resistance After the October 14 Close
Technical levels need to reflect actual market prices rather than an older trading range.
The Nifty 50 closed at 22,622.70 on October 14, 2026. The day’s high was 22,757.95, and its low was 22,558.95. These figures provide a useful starting point for the next session, but they do not establish future support or resistance with certainty.
Key Nifty levels to watch
| Level | Interpretation |
|---|---|
| 22,850–22,900 | Potential higher resistance zone to monitor |
| 22,750–22,760 | Immediate resistance near the previous session’s high |
| 22,620–22,630 | Previous close and near-term reference area |
| 22,550–22,560 | Immediate support near the previous session’s low |
| 22,300 | Lower reference level if selling intensifies |
| 22,000 | Major psychological level |
These are indicative technical reference zones based on the latest close, the supplied market context and round-number levels. They are not guaranteed reversal points or independently verified institutional positions.
Bullish scenario
If the Nifty moves above 22,760 and sustains the breakout, traders could watch the 22,850–22,900 zone next. A sustained move above that area would require further confirmation from market breadth, sector participation and trading volume.
Bearish scenario
If the index breaks below 22,550–22,560 and remains weak, the 22,300 zone could become a lower reference point. Continued selling could bring the psychological 22,000 level into focus.
Sideways scenario
If the index remains between approximately 22,550 and 22,760, the market may continue consolidating while traders wait for fresh cues from crude oil, institutional flows, earnings and global inflation data.
A move beyond the range should be evaluated using closing prices and follow-through rather than a brief intraday breach.
A practical risk-management framework
- Define the trade’s invalidation level before entering.
- Calculate position size using the distance to the stop-loss.
- Avoid increasing position size simply because the market has moved against the trade.
- Be especially cautious with leveraged futures and options when volatility rises.
- Reassess the setup if geopolitical news materially changes the market environment.
For example, a trader with ₹50,000 of trading capital who limits planned risk to 1% would risk ₹500 on a trade before allowing for slippage and charges. If the planned stop-loss distance is ₹25 per unit, the theoretical position size is 20 units, subject to the instrument’s lot size and other trading constraints.
This is an educational example, not a recommendation to take a particular Nifty position.
Conclusion: Follow the Data, Not the Carrot
The October 14 market reversal highlights the tension between domestic economic resilience and external financial risks.
India’s 7.8% first-quarter GDP growth provides a constructive economic backdrop. The upcoming Jio Platforms IPO represents a major corporate-financing event. Expectations of LTCG and STT relief may influence sentiment. Yet rising crude oil prices, foreign investor selling and geopolitical uncertainty can still exert substantial pressure on equities.
The critical distinction is between a market narrative and a confirmed market trend.
A positive policy headline may trigger a rally, but a sustainable recovery needs broader support from earnings, liquidity, institutional participation and macroeconomic conditions.
For the next few sessions, investors should focus on five indicators:
- Brent crude: Whether elevated prices persist or begin to retreat.
- Nifty 50: Whether the index can reclaim and sustain levels above its recent trading range.
- FII and DII flows: Whether domestic buying offsets continued foreign selling.
- Corporate earnings: Whether results and management guidance support current valuations.
- US inflation and interest-rate expectations: Whether global financial conditions become more or less supportive of emerging markets.
The upcoming Jio IPO deserves close attention, but there is insufficient evidence to conclude that market levels are being deliberately engineered to protect the offering.
Ultimately, investors are better served by verified disclosures, disciplined risk management and evidence-based analysis than by attempts to predict hidden motives behind every market move.
What is your view? Will falling crude prices and improving institutional flows support a Nifty recovery, or will persistent geopolitical risks keep the market under pressure? Share your analysis in the comments.
Frequently Asked Questions (FAQs)
1. Why did the Nifty 50 fall on October 14, 2026?
The Nifty 50 fell 99.25 points, or 0.44%, to close at 22,622.70. Higher crude oil prices, foreign investor selling, geopolitical uncertainty and caution ahead of US inflation data weighed on sentiment.
2. Has the Indian government announced an LTCG tax cut?
The cited reports describe renewed discussion and expectations around possible LTCG and STT relief. They do not establish that a tax cut has been officially announced. Investors should follow official government notifications for any change.
3. How does crude oil at $106 affect Indian stocks?
Sustained high crude oil prices can increase import expenditure, add pressure to inflation and the rupee, and raise input costs for energy-sensitive businesses. The effects vary by sector and company.
4. When will the Jio Platforms IPO open?
According to the October 14 Reuters report, the Jio Platforms IPO is scheduled to open on October 21, 2026. Investors should confirm the final timetable and offer details in the latest official offer documents.
5. Is the Nifty 50 bullish or bearish now?
The October 14 close indicates short-term pressure after the previous session’s rally. A sustained move above the recent high would strengthen the recovery case, while a break below the recent low could increase downside risk. Neither scenario is certain.
6. Is it safe to buy Nifty call or put options during high volatility?
Options can lose value rapidly because of changes in the underlying index, implied volatility,y and time decay. Traders should understand the maximum potential loss, liquidity, expiry risk and position sizing before entering a trade.
Disclaimer: This article is for educational and informational purposes only. It is not investment advice, a recommendation to buy or sell securities, or a prediction of guaranteed market performance. Market prices and technical levels can change rapidly. Verify financial data, corporate announcements, and tax rules using official sources before making investment decisions.
Top 10 SEO Titles
- Nifty 50 Today: Crude Oil Surge, Jio IPO & LTCG Tax Relief Explained
- Indian Stock Market Analysis: 5 Big Reasons Behind Nifty 50 Volatility
- Crude Oil at $108: Why Rising Oil Prices Are Hurting Indian Stock Markets
- Jio IPO 2026: Can India’s Biggest IPO Impact Nifty 50 and Market Sentiment?
- Nifty 50 Prediction: Key Support, Resistance and Market Outlook
- LTCG Tax Cut News: Will Tax Relief Trigger the Next Stock Market Rally?
- Why Is the Indian Stock Market Falling Despite 7.8% GDP Growth?
- FII Selling Explained: 5 Warning Signs Every Indian Stock Market Investor Should Watch
- Nifty 50 vs Crude Oil: 5 Critical Factors Driving India’s Stock Market
- Stock Market News Today: Jio IPO, Crude Oil Prices and FII Investment Trends