
The Trans-Pacific Policy Pivot: Why Global Markets Rallied Despite Fed and BOJ Rate Hikes
At first glance, the global market reaction looks almost contradictory.
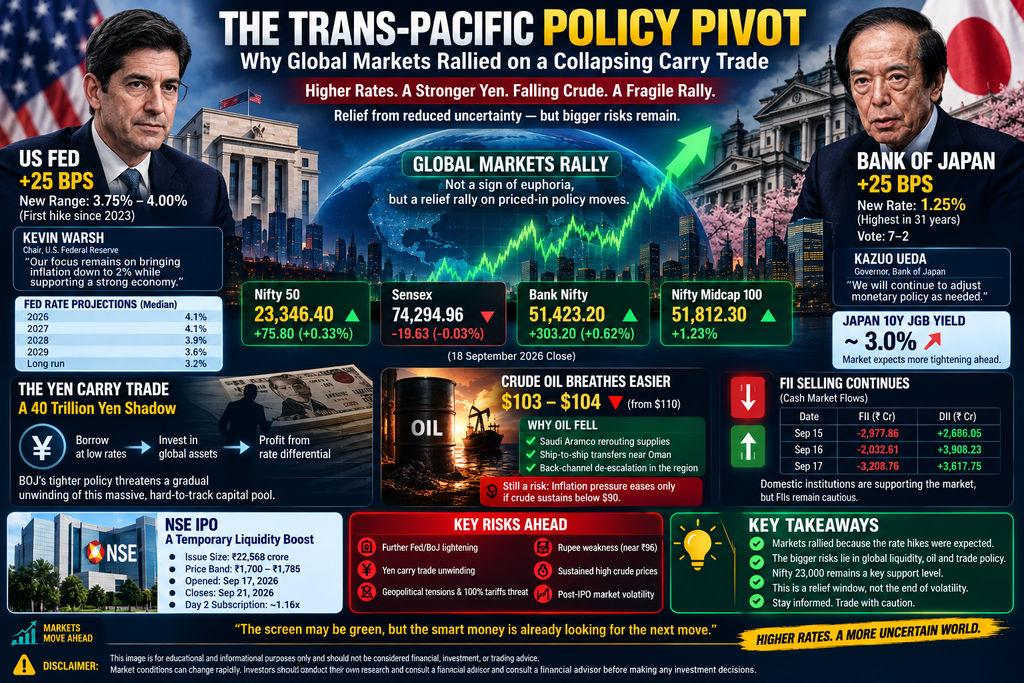
The U.S. Federal Reserve raised rates by 25 basis points, taking its target range to 3.75%-4.00%. Two days later, the Bank of Japan raised its policy rate from 1.00% to 1.25%, the highest level in 31 years.
Yet Indian equities finished the week with a recovery.
On September 18, 2026, the Nifty 50 gained 75.80 points, or 0.33%, to close at 23,346.40, while the Sensex slipped 19.63 points to 74,294.96. Bank Nifty gained more than 300 points,s and the Nifty Midcap 100 rose 1.23%.
So why didn’t markets collapse?
The answer is not that rate hikes have suddenly become bullish.
The more accurate explanation is:
A large part of the immediate policy uncertainty had already been absorbed by markets, while falling crude prices and resilient Asian equities provided a temporary cushion.
But underneath that relief rally, the yen carry trade, foreign selling, elevated oil prices, es and tighter global liquidity remain important risks.
1. The Fed Hike Was Expected — So the Shock Was Limited
The Federal Reserve increased its target range by 25 basis points to 3.75%-4.00% on September 16.
It was the first Fed rate increase since July 2023. The vote was unanimous.
More importantly, markets had already been preparing for the move.
The Fed’s latest projections show a median federal-funds-rate projection of:
| Year | Median Fed projection |
|---|---|
| 2026 | 4.1% |
| 2027 | 4.1% |
| 2028 | 3.9% |
| 2029 | 3.6% |
| Long run | 3.2% |
The September projections also put 2026 PCE inflation at 3.7%, compared with the Fed’s 2% longer-run objective.
This is important because it means the market is not facing an unknown rate trajectory.
The current message is closer to:
25 bps hike → one more possible hike → rates stay elevated through 2027.
Reuters reported that 16 of 18 policymakers see at least one additional rate increase in 2026, although four saw scope for two additional hikes.
So the fear of an unlimited rate spiral has eased—but monetary conditions remain restrictive.
2. The BOJ Delivered the Bigger Global Liquidity Test
Japan is arguably the more interesting part of the story.
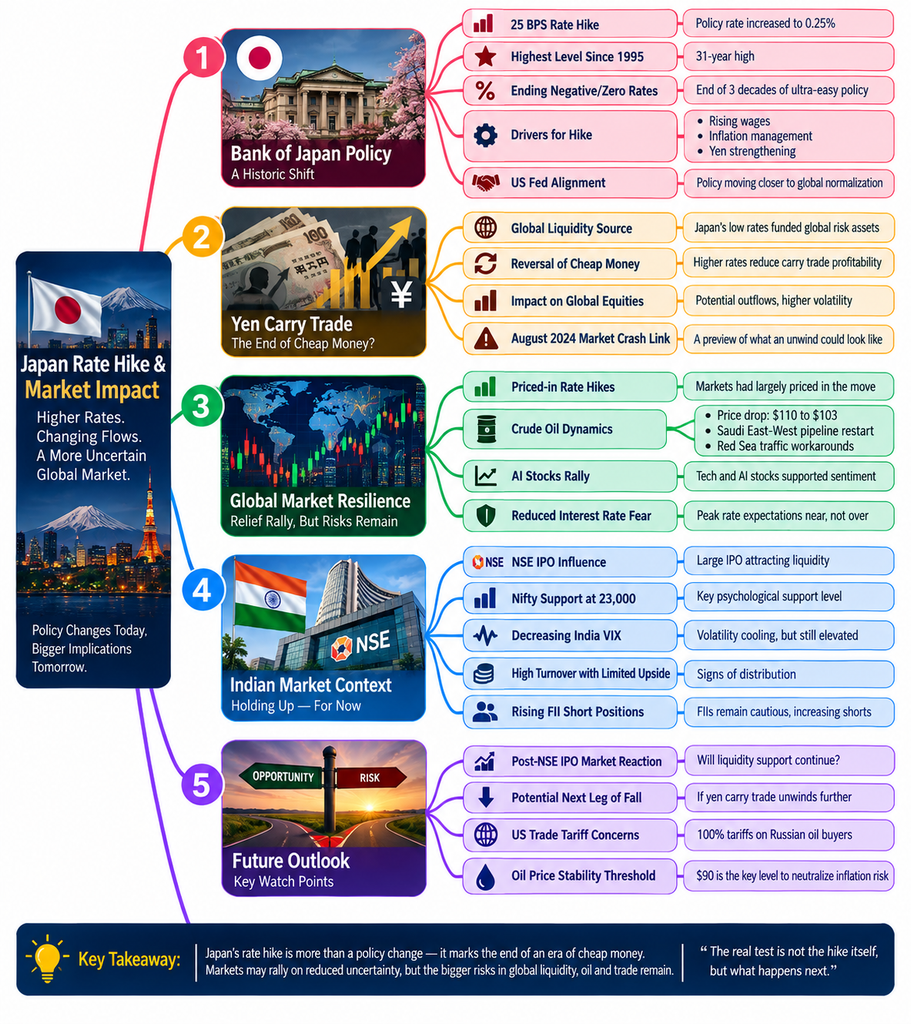
On September 18, the Bank of Japan raised its policy rate from 1.00% to 1.25%, the highest level in 31 years.
The decision passed 7-2, with two board members opposing the increase.
This is a major change from the Japan that global investors became accustomed to during the era of ultra-low interest rates.
For years:
Cheap yen financing
↓
Borrow in Japan
↓
Buy higher-yielding assets elsewhere.
↓
Carry trade
Now:
Japan rates ↑
Yen funding cost ↑
=
Carry-trade economics become less attractive.
That is the real global-market significance of the BOJ decision.
3. But Here Is the Twist: The Yen Actually Weakened
Normally, a rate hike should support a currency.
But on September 18, the opposite happened.
The yen weakened after the BOJ announcement because investors interpreted the decision as less hawkish than some had expected. Reuters reported that the dollar rose about 1.2% to around ¥157.90, while the yen suffered its largest daily and weekly gain in the dollar’s favour since late 2024.
This is an extremely important market lesson:
A rate hike does not automatically mean a stronger currency.
Markets trade the difference between expectations and reality.
If investors expected:
1.25% + strong signal of another hike
but received:
1.25% + cautious forward guidance
then the yen can actually weaken.
And that may temporarily reduce the immediate pressure on the global carry trade.
4. The Yen Carry Trade: Real Risk, Difficult to Measure
The yen carry trade remains one of the most discussed hidden risks in global markets.
The basic mechanism is simple:
Borrow yen cheaply
↓
Convert into dollars/other currencies.
↓
Buy equities, bonds,s or other higher-return assets.
↓
Profit from the interest-rate differential
The danger appears when:
Japanese rates ↑
Yen appreciates
Global volatility ↑
The investor can then face both:
- higher funding costs
- currency losses
That can force deleveraging.
But be careful with the “¥40 trillion” number
Estimates of the size of the global yen carry trade vary considerably because positions are spread across banks, hedge funds, derivatives and offshore structures.
Therefore, it is better to describe ¥40 trillion as an estimate used in market commentary, rather than presenting it as a precisely measurable pool of capital.
The actual exposure is difficult to quantify.
5. The Real Question: Has the Carry Trade Already Started Unwinding?
Possibly—but it is impossible to identify a single number showing exactly how much has unwound.
The recent Indian market correction occurred while investors were simultaneously dealing with:
- Fed tightening expectations
- BOJ tightening
- high crude
- geopolitical risk
- rupee weakness
- FII selling
That makes it difficult to attribute the entire Nifty correction to the yen carry trade.
A better interpretation is:
BOJ tightening is one component of a broader global liquidity tightening.
This distinction makes the analysis more credible.
6. Why Global Markets Still Rallied
There are at least four reasons behind the current resilience.
1. Rate decisions were anticipated
The Fed’s 25-bps move and the BOJ’s 25-bps move were not complete surprises.
2. Oil prices cooled
Brent fell toward the $103-$104 area, providing some relief to inflation-sensitive markets.
3. US equities recovered
US stocks rallied following the Fed decision, with the Nasdaq particularly strong in Thursday’s session.
4. Asian markets remained resilient
Asian equities also traded higher on Friday despite the BOJ hike, reducing immediate risk-off pressure on India.
This combination created a temporary relief environment.
7. Crude Oil: The Market’s Biggest Relief Valve
One of the most important developments this week has been the decline in crude prices.
Earlier in the week, Brent moved above $107-$108.
By September 18, Brent was around $103-$104.
That is still expensive for India.
But the direction matters.
$108 → $103
is a much better environment for Indian equities than:
$103 → $110.
Why?
Because India imports substantial amounts of crude.
Lower oil prices can reduce pressure on:
- India’s import bill
- current account
- inflation
- USD/INR
- corporate input costs
The rupee also received some relief as crude declined.
8. Rupee: Small Relief, Bigger Problem Still Exists
The rupee had been under considerable pressure during the previous sessions.
On September 18, it recovered toward ₹95.73-$95.9 per dollar as crude prices eased and US yields softened after the Fed decision.
But the bigger trend remains important.
The rupee had fallen from around ₹94.43 on September 4 to roughly ₹95.89 on September 17, according to market reports.
So the currency remains vulnerable to:
Oil + Dollar + FII flows + US yields.
9. FIIs Are Still Not Supporting the Rally
This is perhaps the biggest contradiction beneath the green screen.
On September 17:
FII selling
₹3,208.76 crore
DII buying
₹3,617.75 crore
The previous two sessions were also negative for FIIs:
| Date | FII | DII |
|---|---|---|
| Sep 15 | -₹2,977.86 Cr | +₹2,686.05 Cr |
| Sep 16 | -₹2,032.61 Cr | +₹3,908.23 Cr |
| Sep 17 | -₹3,208.76 Cr | +₹3,617.75 Cr |
This creates an important market structure:
Foreign investors are selling, while domestic institutions are absorbing the supply.
That can keep the index stable even when international capital is cautious.
10. Nifty 23,000 Has Survived—For Now
The Nifty’s recovery is significant.
After falling to around 23,118.60 on September 15, the index closed at:
23,270.60 on September 17
and then:
23,346.40 on September 18.
That puts the market back above the 23,300 zone.
Important technical reference points
| Level | Significance |
|---|---|
| 23,000 | Major psychological support |
| 23,100–23,150 | Recent support area |
| 23,300–23,350 | Near-term recovery zone |
| 23,500 | Next major resistance/reference |
| Below 23,000 | Would indicate renewed downside pressure |
These are technical reference levels, not guaranteed targets.
11. Is the Rally Actually Strong?
The answer requires looking beyond the headline index.
On September 18, Nifty gained 0.33%, but the Sensex finished almost flat at -0.03%. Bank Nifty gained about 303 points, and Midcap 100 rose 1.23%.
At the same time, several major stocks declined sharply.
For example:
- TCS fell about 4.3%
- Asian Paints fell around 2%
- Maruti declined almost 2%
- Tech Mahindra fell around 1.8%
That suggests the market recovery was not broad-based across every major sector.
So calling the session a full-fledged bullish breakout would be premature.
12. The NSE IPO Is Another Liquidity Factor
The NSE IPO opened on September 17 and is scheduled to close on September 21.
The issue size is approximately ₹22,568 crore, with a price band of ₹1,700-₹1,785.
By the second day, the issue was reported as fully subscribed at around 1.16 times, with more than 20 lakh applicants.
This is important because a large IPO can temporarily absorb substantial investor liquidity.
However, it would be too strong to claim that the NSE IPO alone is “holding up” Nifty.
The market is being influenced by multiple factors simultaneously.
A better formulation is:
The IPO is an additional liquidity consideration during a period when FII flows are already weak.
13. The “Distribution” Question
Your original article calls the September 18 action distribution because turnover was high while price gains remained relatively limited.
That is a reasonable technical hypothesis, but it should not be presented as a confirmed fact from one session.
Distribution is usually more convincing when we see a repeated pattern of:
- high volume,
- limited upside,
- repeated failure near resistance,
- institutional selling,
- weakening breadth.
Therefore, the next few sessions matter more than one day’s turnover.
14. The Biggest Macro Change: Fed + BOJ Are No Longer the Only Story
The market narrative has evolved.
Earlier:
Phase 1
Fed rate hike fear
Now:
Phase 2
Fed + BOJ + Oil + Yen + FII flows
And another major risk remains:
Phase 3
Russia-oil tariffs and global trade policy
The U.S. House recently passed legislation giving the President authority to impose tariffs of up to 100% on countries buying Russian energy.
That means India faces a separate geopolitical and energy-market risk.
So the market is not simply asking:
“Will rates rise?”
It is increasingly asking:
“What happens to global liquidity, energy prices and trade flows if multiple major economies tighten policy simultaneously?”
15. Why the 2026 Market Is Different
The traditional market playbook was:
US rates ↓
→ liquidity ↑
→ emerging markets ↑
But today’s environment is more complicated.
We now have:
US rates ↑
Japan rates ↑
Oil > $100
Dollar elevated
FII selling
Geopolitical uncertainty
That is not a classic easy-liquidity environment.
Yet equities can still rise because markets are forward-looking and constantly reprice expectations.
16. Three Possible Paths From Here
🟢 Scenario 1: Relief Rally Continues
If:
- crude moves below $100,
- rupee stabilises,
- FII selling slows,
- US yields decline,
- BOJ avoids signalling rapid further hikes,
then Nifty could continue consolidating/recovering.
🟡 Scenario 2: Range-Bound Market
If:
- crude stays between $100-$105,
- FIIs continue selling,
- DIIs keep buying,
- Nifty holds 23,000,
the market could remain volatile but range-bound.
🔴 Scenario 3: Liquidity Shock
If:
- yen strengthens sharply,
- BOJ signals rapid further tightening,
- US yields rise,
- crude returns above $110,
- FII selling accelerates,
then the carry-trade and emerging-market risk could become more visible.
This would be a very different environment from the current relief rally.
17. What Investors Should Monitor Next Week
The next week should be watched through a macro dashboard, not a single indicator.
🇺🇸 United States
- US 10Y yield
- Dollar Index
- Fed rate expectations
- inflation data
- equity-market breadth
🇯🇵 Japan
- USD/JPY
- JGB yields
- BOJ communication
- future rate-hike expectations
🇮🇳 India
- Nifty 23,000
- Nifty 23,350
- Bank Nifty
- India VIX
- FII/DII flows
- USD/INR
🛢️ Commodities
- Brent crude
- WTI
- shipping disruptions
- Middle East supply developments
🌍 Geopolitics
- Russia-oil tariff developments
- India-US trade negotiations
- Iran/Yemen developments
- Hormuz shipping
18. The Most Important Data Points Right Now
September 18, 2026
| Indicator | Data |
|---|---|
| Nifty 50 | 23,346.40 |
| Nifty daily change | +0.33% |
| Sensex | 74,294.96 |
| Sensex daily change | -0.03% |
| Brent crude | ~$103-$104 |
| USD/INR | ~₹95.9 |
| Fed rate | 3.75%-4.00% |
| BOJ rate | 1.25% |
| BOJ vote | 7-2 |
| FII selling, Sep 17 | ₹3,208.76 Cr |
| DII buying, Sep 17 | ₹3,617.75 Cr |
| NSE IPO | ₹22,568 Cr |
| NSE IPO closes | September 21 |
Conclusion: The Green Screen Is Not the End of the Risk
The most interesting part of the current market is not that equities rallied after the Fed and BOJ raised rates.
It is why they rallied.
The Fed delivered an expected 25-bps hike.
The BOJ raised rates to 1.25%, the highest in 31 years.
Yet Nifty finished the week at 23,346.40.
The immediate fear has therefore been partially absorbed.
But the underlying risks remain.
The yen carry trade is becoming more expensive.
US rates are expected to remain elevated.
Japan is no longer providing the same ultra-cheap funding environment.
Crude remains above $100.
The rupee remains around ₹96.
FIIs are still selling.
And a huge ₹22,568-crore NSE IPO is currently absorbing investor attention and liquidity.
So the current rally should not automatically be interpreted as confirmation that the global tightening cycle is harmless.
A better way to describe the market is:
The immediate policy shock has been absorbed, but the structural liquidity risk has not disappeared.
The next major signal will come from the interaction of yen, oil, US yields and FII flows.
If those four variables stabilize, the Nifty recovery can gain credibility.
If they move sharply against emerging markets, the carry-trade risk could return to the centre of the global market narrative.
The real question for Dalal Street is therefore not:
“Did the Fed and BOJ hike rates?”
It is:
“Can global markets absorb higher rates without triggering a disorderly reversal of the liquidity that supported the previous bull cycle?”
That is the question investors will be watching next.
SEO FAQ
Q1. Why did Nifty rise despite the Fed and BOJ rate hikes?
Both moves were broadly anticipated, while lower crude prices and positive global cues provided some support. Nifty closed at 23,346.40 on September 18.
Q2. What is the current Bank of Japan interest rate?
The BOJ raised its policy rate to 1.25% on September 18, 2026, the highest level in 31 years. The decision was 7-2.
Q3. What is the yen carry trade?
It involves borrowing in a low-interest-rate currency such as the yen and investing in assets offering potentially higher returns elsewhere. Rising Japanese rates or a stronger yen can make the strategy less attractive.
Q4. Is the yen carry trade worth ¥40 trillion?
Some market estimates cite figures around that level, but the true size is difficult to measure because exposures exist across derivatives, banks, hedge funds and offshore structures.
Q5. What is the key Nifty support level?
The 23,000 area remains an important psychological reference level, while 23,300-23,350 is an important near-term recovery zone.
Q6. Are FIIs still selling Indian stocks?
Yes. FIIs sold approximately ₹3,208.76 crore on September 17, while DIIs bought approximately ₹3,617.75 crore.
Q7. When does the NSE IPO close?
The NSE IPO opened on September 17 and is scheduled to close on September 21, 2026.
Q8. Why is crude oil important for Nifty?
India is heavily dependent on imported crude. Sustained high oil prices can increase the import bill, inflation pressure, and pressure on the rupee.
Q9. What should traders watch after the BOJ hike?
The key indicators are USD/JPY, JGB yields, US 10Y yield, Brent crude, USD/INR, FII flows and Nifty 23,000-23,350.
Q10. Does the current rally mean the yen carry-trade risk is over?
No. The BOJ’s rate hike changes funding conditions, but the actual scale and speed of any carry-trade unwinding cannot be determined from one market session.
⚠️ Disclaimer
Disclaimer: This article is for educational and informational purposes only and should not be considered financial, investment, trading, or legal advice. Stock-market, currency, interest-rate, crude-oil, and geopolitical developments can change rapidly, and past performance does not guarantee future results.
The market data, analysis, scenarios, and interpretations presented are based on information available at the time of writing and may contain errors or omissions. Any discussion of Nifty levels, sectors, stocks, or market scenarios is not a recommendation to buy, sell, or hold any security.
Investors should conduct their own research and consider their risk tolerance, investment objectives, and financial situation before making any investment decision. Derivatives and leveraged trading involve substantial risk and may result in significant losses.
Investing and trading decisions are solely the responsibility of the individual investor.
🔥 Top 10 SEO Titles
- Japan Rate Hike 2026: How BOJ Policy Could Impact Nifty, Yen Carry Trade and Global Markets
- BOJ Rate Hike Explained: Why Japan’s Interest Rate Decision Matters for Nifty and Investors
- Japan Interest Rate Hike: Yen Carry Trade Unwinding and Its Impact on Indian Stock Market
- Nifty After Japan Rate Hike: Yen Carry Trade, Crude Oil and FII Flows Explained
- Bank of Japan Rate Hike 2026: What It Means for Nifty, Bank Nifty and Global Markets
- Yen Carry Trade Unwinding: Why Japan’s Rate Hike Could Change Global Market Liquidity
- Japan Raises Interest Rates: Hidden Impact on Indian Stocks, Nifty and Global Liquidity
- BOJ Interest Rate Hike 2026: 5 Key Risks for Nifty and Indian Investors
- Japan Rate Hike and Indian Stock Market: Yen, FII Selling, Crude Oil and Nifty Explained
- Why Japan Rate Hike Matters for Nifty: The Yen Carry Trade Risk Every Investor Should Know