
Indian Stock Market Crash: Why Did Nifty Fall 383 Points?
Indian equity markets experienced one of their sharpest single-session declines of the recent period on 24 September 2026.
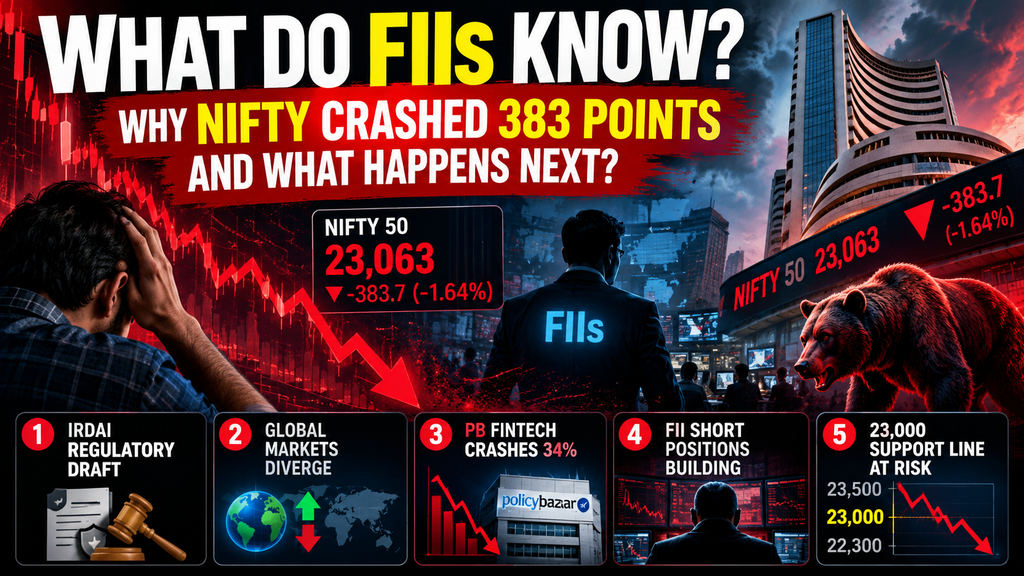
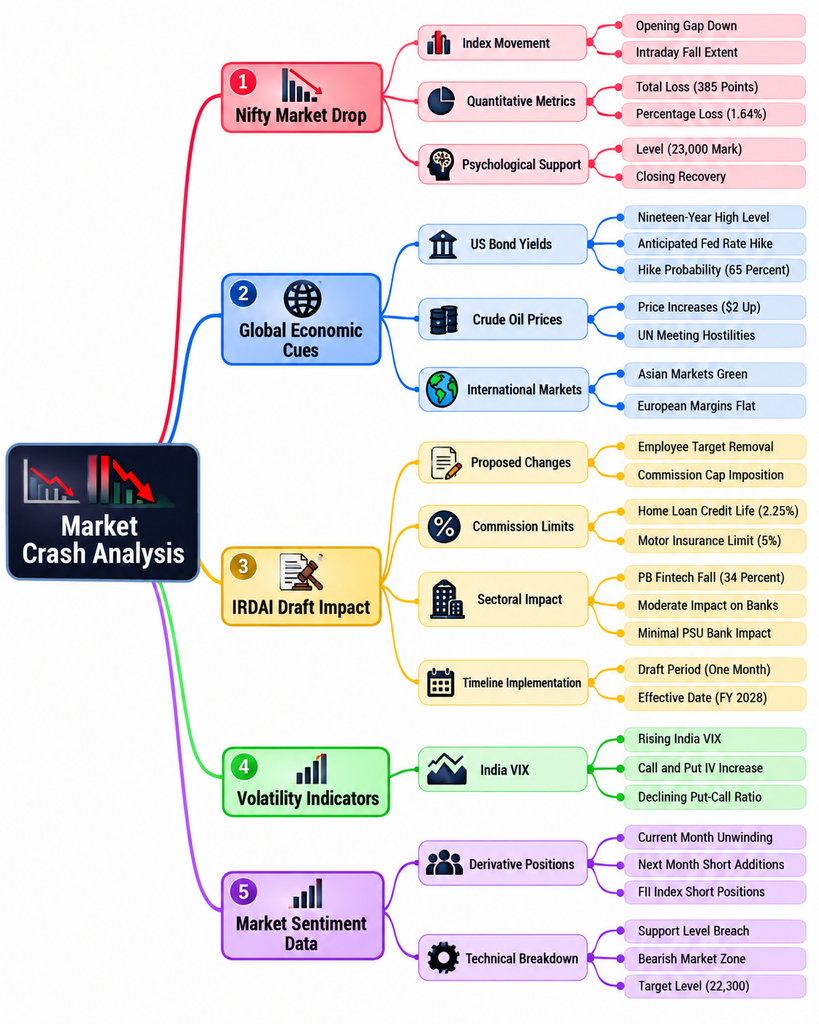
The Nifty 50 fell 383.7 points, or 1.64%, to close at 23,063.10, while the Sensex declined 1.67% to 73,580.54. Bank Nifty was even weaker, falling 1.96% to 55,438.50.
The selling was not limited to a handful of stocks.
Market breadth was extremely weak, with approximately 2,511 stocks declining against only 806 advancing on the NSE. The advance-decline ratio therefore fell to around 0.32, indicating broad-based selling rather than a simple index adjustment.
At the same time, the India VIX jumped 22.6% to 12.69, showing a sharp increase in expected market volatility.
That combination raises a bigger question:
Was the IRDAI proposal really enough to explain such a broad market sell-off, or was the regulatory announcement simply the trigger for a market that was already vulnerable?
1. The IRDAI Shock: Trigger or Complete Explanation?
The immediate catalyst was the Insurance Regulatory and Development Authority of India’s proposed overhaul of insurance distribution economics.
The consultation paper proposes product- and channel-specific commission limits and tighter expense-management rules. Feedback on the proposal is open until October 25, 2026, with parts of the proposed framework expected to take effect from FY28 if ultimately adopted.
The important point is that the proposal does not affect every financial company equally.
Credit-linked insurance and certain loan-linked insurance products face particularly sharp proposed commission reductions. Business Standard reported, for example, a proposed credit-life commission cap of around 2% versus substantially higher existing economics in that segment.
This creates three different levels of potential impact:
High exposure
- Insurance aggregators
- Insurance distributors
- Businesses heavily dependent on commissions
- Certain NBFC distribution models
Medium exposure
- Private banks with meaningful insurance-distribution fee income
- Bancassurance-heavy businesses
Lower direct exposure
- Banks with relatively diversified fee income
- Businesses with limited dependence on insurance distribution
Therefore, the market reaction cannot simply be described as “IRDAI is bad for all banks.”
The economic impact depends on the company’s revenue mix, commission structure, customer acquisition cost, and ability to adjust operating expenses.
2. PB Fintech Became the Market’s Biggest Warning Signal
The clearest example was PB Fintech, the parent of Policybazaar.
On September 24, PB Fintech plunged approximately 34% to ₹1,244.50, wiping out roughly ₹30,000 crore in market capitalisation,n according to Moneycontrol.
Why was the reaction so extreme?
Because unlike a diversified bank, PB Fintech’s economics are much more directly connected to insurance distribution.
Brokerage assessments cited by Business Standard and Moneycontrol highlighted the possibility of significant earnings pressure if the proposed commission structure is implemented. Estimates varied depending on assumptions about commission rates, costs, ts and business mix.
This is where valuation risk becomes important.
A high-growth company can trade at a high valuation because investors expect substantial future earnings growth.
If the market suddenly believes that:
Revenue growth ↓
- Commission per policy ↓
- Customer acquisition economics deteriorate
- Marketing costs remain high
= Future earnings estimates ↓
then the valuation multiple can contract simultaneously.
That creates a much larger stock-price adjustment than the direct revenue impact alone might suggest.
3. But Why Did the Entire Nifty Fall?
This is the most important part of the story.
If the IRDAI proposal was primarily responsible, why did sectors outside insurance distribution also decline?
The answer appears to be a combination of factors rather than one isolated trigger.
On September 24:
- Nifty: -1.64%
- Sensex: -1.67%
- Bank Nifty: -1.96%
- Nifty Financial Services: -2.39%
- Private Banks: -2.19%
- Metals: -1.96%
- Auto: -1.57%
- Energy: -1.06%
- IT: -0.44%
- Pharma: -0.45%
The sector pattern is revealing.
Financial stocks were hit harder, which is consistent with the IRDAI catalyst.
But IT and pharma also fell, while midcaps declined approximately 2.25%.
So the session looked more like:
IRDAI shock + macro pressure + institutional risk reduction + derivatives positioning
rather than a pure insurance-sector correction.
4. Global Macro Was Another Piece of the Puzzle
The same session also featured pressure from global macro variables.
US Treasury yields had moved sharply higher, crude oil prices were above $100 per barrel, and expectations around US monetary policy were adding uncertainty.
Moneycontrol described the September 24 decline as the worst single-session performance for the benchmark indices in roughly ten weeks and highlighted higher US Treasury yields and crude prices among the major factors.
For India, higher crude prices matter because India remains a major crude importer.
A sustained rise in crude can create pressure through:
Higher crude → higher import bill → pressure on trade balance → rupee pressure → inflation concern → interest-rate uncertainty
That does not automatically mean the market must fall.
But when valuations are already sensitive to interest rates and liquidity, the combination can increase risk aversion.
5. FII Selling: The Bigger Signal?
Foreign institutional activity provides another important piece of the puzzle.
On September 24, provisional FII cash-market selling was approximately:
₹5,027 crore
At the same time, domestic institutional investors bought approximately:
₹4,301 crore
So DIIs absorbed a substantial portion of the foreign selling, but they did not prevent the index from falling sharply.
This is important because it shows that the market was experiencing real institutional distribution, rather than simply retail panic.
However, FII cash selling alone does not prove that foreign investors knew about an undisclosed event.
It only establishes that foreign institutional positioning was defensive on that session.
6. The Derivatives Market Sends a More Interesting Signal
The derivatives market deserves particular attention.
Participant-wise data shows that FII net index-futures positioning was already significantly short.
On:
September 23: approximately -2.99 lakh contracts
September 24: approximately -3.10 lakh contracts
September 25: approximately -3.12 lakh contracts
The 24 September decline therefore occurred alongside an already heavily negative FII index-futures position.
This is more meaningful than simply looking at one day’s cash-market selling.
It suggests that foreign participants were maintaining a substantial downside hedge or bearish futures exposure.
But there is an important distinction:
A large FII short position does not automatically mean FIIs know a secret event is coming.
Futures positions can represent directional views, hedges, relative-value trades or portfolio protection.
Therefore, the correct interpretation is:
FII positioning = warning signal
not
FII positioning = proof of inside knowledge.
7. Was There Fresh Shorting in the October Series?
This is where the market structure becomes particularly interesting.
Forward-month futures activity showed substantial changes around the expiry rollover period, with reports indicating significant additions in October futures across Nifty and Bank Nifty.
That matters because September expiry was approaching.
Institutional traders routinely roll positions from the expiring contract into the next series.
Therefore, increased October short exposure can represent both:
- genuine bearish positioning, and
- expiry-related rollover activity.
The distinction is crucial.
The bearish interpretation becomes stronger if:
October OI ↑
- price ↓
- futures discount ↑
- Put OI unwinding
- Call OI addition
- VIX ↑
occur together.
That combination would represent a much stronger downside confirmation than simply saying “40,000 shorts were added.”
8. India VIX Gave a Clear Warning
India VIX jumped from roughly 10.35 to 12.69, an increase of approximately 22.6% on September 24.
This is significant because volatility rose while the index fell sharply.
The combination:
Nifty ↓ + VIX ↑
usually indicates increasing demand for downside protection and greater uncertainty.
But VIX at 12.69 is not historically extreme.
Therefore, the correct interpretation is:
Risk perception increased sharply.
It does not necessarily mean the market had entered a full-blown panic regime.
9. Option Chain: 23,000 Became the Battlefield
The 23,000 level became extremely important.
Data around the September expiry showed substantial Put OI around 23,000, while 23,500 emerged as an important Call-OI zone. One option-chain analysis showed approximately 180,885 contracts of Put OI at 23,000 and 208,801 contracts of Call OI at 23,500.
That creates a simple market map:
| Nifty Zone | Interpretation |
|---|---|
| 23,500–23,600 | Immediate recovery/resistance zone |
| 23,200–23,300 | Short-term pivot |
| 23,000 | Major psychological support |
| 22,500 | Next important downside zone |
| 22,300 | Larger technical downside objective |
The most important level remains 23,000.
10. What Happens If Nifty Breaks 23,000?
The technical structure becomes considerably weaker if Nifty decisively loses 23,000.
A clean breakdown would ideally involve:
Nifty below 23,000
- strong volume
- weak market breadth
- rising VIX
- fresh futures shorting
- Put OI unwinding
- Call OI addition
That would provide much stronger confirmation of a downside continuation.
In such a scenario, 22,500 becomes an important intermediate level, while 22,300 becomes a larger technical target zone.
But traders should distinguish between an intraday violation and a confirmed breakdown.
A temporary move below 23,000 followed by a strong recovery would represent a very different market structure from a sustained close below the level.
11. What If 23,000 Holds?
The opposite scenario is equally important.
Markets frequently experience sharp technical rebounds after large one-day declines.
If Nifty holds 23,000 and begins reclaiming:
23,200 → 23,300 → 23,500
then the September 24 decline could increasingly be interpreted as a sharp correction rather than the beginning of a much deeper structural breakdown.
The most important confirmation would be whether the market can reclaim the 23,500 region with improving breadth and declining volatility.
Until that happens, traders should treat rallies cautiously rather than assuming that one strong bounce has completely reversed the trend.
12. The FII-DII Battle Is the Real Market Story
There is another fascinating feature in the data.
Despite heavy FII selling, domestic institutions continued to absorb supply.
For the 30 days ending September 25, the Economic Times data showed approximately:
FII net selling: ₹31,556.7 crore
versus
DII net buying: ₹62,389.6 crore.
This creates an important structural battle:
Foreign investors
Reducing exposure / maintaining defensive positioning.
Domestic institutions
Absorbing a large portion of that supply.
This explains why a substantial amount of foreign selling does not automatically translate into a complete market collapse.
The domestic institutional bid can provide a cushion.
But if foreign selling accelerates while DII buying weakens, the downside pressure could increase.
13. Why the Market Reaction Looks Bigger Than the Fundamental Damage
This is perhaps the most important lesson from the entire episode.
Markets do not price today’s earnings.
They price expected future earnings and the valuation investors are willing to pay for those earnings.
Suppose an insurance-dependent business has:
Revenue ↓ 5%
but
Expected long-term growth ↓ significantly
and
Valuation multiple ↓ 30%
The stock-price decline can become dramatically larger than the immediate revenue impact.
This explains why PB Fintech could fall much more violently than a diversified bank.
The market was not simply calculating:
“How much revenue will IRDAI remove?”
It was also asking:
“What should this company’s future earnings multiple be under the new regulatory economics?”
That is a much bigger valuation question.
14. What FIIs May Be Pricing In
There are several possible explanations for the bearish institutional positioning.
Scenario A — Pure hedge
FIIs may simply be protecting large equity portfolios against volatility.
Scenario B — Macro risk
Higher crude, bond yields and currency pressure may be encouraging defensive positioning.
Scenario C — Earnings revision risk
Financial-sector earnings expectations could be adjusted if regulatory changes materially affect distribution economics.
Scenario D — Technical breakdown
A break of important Nifty support levels can trigger systematic futures selling.
Scenario E — Combination
This may be the most straightforward interpretation of the available data:
Regulatory shock + macro pressure + weak breadth + FII selling + bearish derivatives positioning
rather than a single hidden event.
There is currently no verified evidence in the data reviewed here that FIIs were acting on some undisclosed piece of information.
15. October 2026: Three Market Scenarios
Scenario 1 — Bullish Recovery
Conditions:
- Nifty holds 23,000
- VIX cools
- FII short positions reduce
- Breadth improves
- Nifty reclaims 23,300–23,500
Under this structure, the September sell-off could become a failed breakdown.
Scenario 2 — Range-Bound Consolidation
Conditions:
- 23,000 holds
- 23,500 remains resistance
- VIX stays elevated
- FIIs remain short
- DIIs continue buying
The market could remain trapped between approximately 23,000 and 23,500 while investors wait for clarity on regulation, crude and global rates.
Scenario 3 — Bearish Breakdown
Conditions:
- Nifty decisively breaks 23,000
- Put OI unwinds
- Fresh futures shorts appear
- VIX rises further
- Market breadth remains extremely weak
Then:
23,000 → 22,500 → 22,300
becomes the important downside roadmap.
16. The Technical Roadmap for Traders
For short-term traders, the market can be simplified into four zones.
🔴 Below 23,000
Bearish confirmation zone.
🟡 23,000–23,200
High-volatility battle zone.
🟢 23,300–23,500
Recovery confirmation zone.
🔵 Above 23,500
The immediate bearish breakdown thesis begins to weaken.
The important point is not to predict the market from one candle.
Instead, traders should watch whether price + OI + VIX + breadth + FII positioning confirm the same direction.
17. The Biggest Warning Isn’t the IRDAI Draft
The biggest warning may actually be the combination of signals.
One signal can be noise.
Two signals can be coincidence.
But when multiple independent indicators move together:
Nifty ↓
Bank Nifty ↓
Breadth ↓
FII cash selling ↑
FII futures positioning bearish
VIX ↑
Financial stocks ↓
Midcaps ↓
The probability of a genuine risk-off session becomes much stronger.
That does not tell us exactly where the market will go next.
But it tells us that risk management has become more important.
Conclusion: Do FIIs Know Something We Don’t?
The September 24 market crash certainly raises the question.
The data confirms that foreign investors were selling heavily in the cash market and maintaining substantial net-short index-futures exposure. At the same time, India VIX jumped more than 22%, market breadth deteriorated dramatically, and financial stocks came under disproportionate pressure.
But there is a major difference between institutional caution and inside knowledge.
The evidence currently supports the first, not the second.
The IRDAI proposal was a genuine catalyst, particularly for insurance distributors and companies whose economics depend heavily on insurance commissions. PB Fintech’s 34% collapse demonstrates how severely the market can reprice businesses whose future unit economics are suddenly questioned.
But the broader Nifty decline appears to have involved several simultaneous forces:
IRDAI regulatory shock
FII selling
bearish derivatives positioning
higher global yields
elevated crude prices
weak financial stocks
extremely poor market breadth
rising volatility
The next major battle is therefore not about guessing what FIIs “know.”
It is about watching what the market does next around 23,000.
If 23,000 holds and breadth improves, a recovery toward 23,300–23,500 becomes technically relevant.
If 23,000 breaks decisively with confirmation from derivatives, breadth and volatility, the downside map opens toward 22,500 and potentially 22,300.
For investors, the message is simple:
Don’t try to predict the secret. Watch the evidence.
Because in markets, positioning can provide a warning—but price confirmation ultimately provides the evidence.
Frequently Asked Questions (FAQ)
1. Why did the Nifty crash on September 24, 2026?
Nifty fell sharply amid a combination of factors, including the proposed IRDAI insurance-distribution changes, heavy FII selling, weakness in financial stocks, rising India VIX, higher global bond yields, elevated crude prices, and bearish derivatives positioning.
2. How much did the Nifty fall?
Nifty 50 fell approximately 383.7 points, or 1.64%, closing at 23,063.10 on September 24, 2026.
3. Did the IRDAI draft cause the entire stock market crash?
The IRDAI proposal appears to have been an important catalyst, particularly for insurance-related businesses. However, the broad market decline involved several other factors, including FII selling, derivatives positioning, global macroeconomic concerns and weak market breadth.
4. Why did PB Fintech fall so sharply?
PB Fintech has significant exposure to insurance distribution economics. Investors were concerned that proposed changes to insurance commissions could affect future revenue and profitability assumptions. The resulting reassessment of future earnings and valuation contributed to the sharp decline in the stock.
5. What is the significance of FII short positions?
Large FII short positions indicate that foreign institutional participants have substantial downside exposure or hedging positions in index futures. However, short positions do not necessarily mean that FIIs know about an undisclosed event.
6. Did FIIs know something that retail investors didn’t?
There is no verified evidence that FIIs were trading on undisclosed information. Their positioning can reflect hedging, portfolio protection, macro views, rollover activity, arbitrage,e or directional expectations.
7. What happened to India VIX?
India VIX increased sharply during the sell-off, reaching approximately 12.69, reflecting a significant increase in expected market volatility.
8. Why is 23,000 important for Nifty?
23,000 is both a major psychological level and an important technical zone. A sustained hold could attract buying interest, while a confirmed breakdown accompanied by weak breadth and rising volatility could increase downside risk.
9. What happens if Nifty breaks 23,000?
If Nifty decisively breaks and sustains below 23,000, traders may watch 22,500 as an intermediate level and approximately 22,300 as a larger technical downside zone. These are analytical levels, not guaranteed targets.
10. What is the immediate resistance for Nifty?
The 23,300–23,500 area is an important recovery and resistance zone. A sustained move above 23,500 could weaken the immediate bearish technical structure.
11. Is the Indian stock market entering a bear market?
One sharp decline by itself does not establish a bear market. Investors would need to evaluate the broader trend, earnings, market breadth, liquidity, valuations, FII/DII flows and price structure over a longer period.
12. Why did Bank Nifty fall more than Nifty?
Banking and financial stocks were particularly sensitive to the IRDAI proposal because insurance distribution contributes to fee income for some financial institutions. Additional pressure came from the broader risk-off environment.
13. Are PSU banks also affected by the IRDAI proposal?
PSU banks can also be affected, but the impact depends on their individual insurance-distribution exposure and revenue mix. The effect should therefore be evaluated on a bank-by-bank basis rather than assuming identical impact across the sector.
14. What should traders watch in October 2026?
Key indicators include:
- Nifty’s ability to hold or reclaim 23,000
- Resistance around 23,300–23,500
- FII cash-market flows
- FII index-futures positioning
- India VIX
- Put and Call OI changes
- Market breadth
- Crude oil prices
- US Treasury yields
- USD/INR movement
- Developments regarding the IRDAI proposal
15. Can Nifty recover after such a sharp fall?
Yes, a sharp one-day decline can be followed by a technical rebound. However, the quality of the recovery matters. Improving breadth, falling VIX, reduction in short positions and a sustained move back above important resistance levels would provide stronger evidence of recovery.
16. Is this a good time to buy stocks?
There is no universal answer. Investors should evaluate individual companies based on valuation, earnings, balance-sheet strength, business outlook and personal risk tolerance rather than making decisions solely from a single market decline.
17. What is the biggest risk for investors now?
The key risk is that multiple negative factors could reinforce one another: persistent FII selling, weak earnings expectations, elevated crude prices, higher global yields, increasing volatility and a sustained break of important technical support.
18. What is the main takeaway from the market crash?
The most important lesson is that one headline rarely explains a major market move completely. Investors should evaluate price action alongside fundamentals, derivatives positioning, institutional flow volatility,t y and global macroeconomic conditions.
Final Takeaway
The question is not simply “What do FIIs know?”
The more useful question is:
“What is the market telling us through price, volume, breadth, volatility and institutional positioning?”
That evidence should be monitored continuously rather than relying on speculation about undisclosed information.
⚠️ Disclaimer
This article is intended for educational and informational purposes only and should not be considered investment advice, financial advice, trading advice, or a recommendation to buy or sell any security, stock, index, option, futures contract, or other financial instrument.
The market data, FII/DII activity, derivatives positioning, technical levels, regulatory developments, and other information discussed in this article are based on publicly available sources and are presented for analytical purposes. While reasonable efforts have been made to maintain accuracy, market data can change, contain errors, or be revised, and no guarantee is given regarding the completeness or accuracy of the information.
References to FII positioning, short positions, market movements, or potential scenarios do not imply that institutional investors possess undisclosed information or insider knowledge. Derivatives positions can represent hedging, arbitrage, portfolio management, rollover activity, or directional trading.
Technical support, resistance, targets, scenarios, and market levels mentioned in this article are illustrative analytical levels, not guaranteed predictions. Actual market prices can move significantly because of unexpected economic, political, regulatory, geopolitical, or company-specific developments.
Investors should conduct their own research and consider their financial objectives, risk tolerance, investment horizon, and financial circumstances before making any investment or trading decision. Consult a SEBI-registered investment adviser or other qualified financial professional where appropriate.
Trading in futures and options involves substantial risk and may result in significant losses, including the loss of the entire capital invested.
The author/publisher assumes no responsibility for any financial loss, damage, or liability arising from decisions made based on the information presented in this article.
Past performance is not indicative of future results.
For educational purposes only. Not a buy/sell recommendation.
Top 10 titles:
- What Do FIIs Know? Why Nifty Crashed 383 Points and What Happens Next
- Nifty Crash Explained: FII Selling, IRDAI Shock and the 23,000 Support Battle
- Why Did Nifty Crash Today? FII Shorts, IRDAI Rules and the Road to 22,300
- Indian Stock Market Crash: What FIIs Are Signaling About Nifty’s Next Move
- Nifty Falls 383 Points: IRDAI Shock, FII Selling and the October Market Risk
- FII Short Selling Explained: Is Nifty Heading Below 23,000?
- Why Indian Stocks Crashed: IRDAI Draft, FII Selling, VIX Spike and Nifty Outlook
- Nifty 23,000 at Risk: What FII Futures Positioning Tells Investors
- Indian Market Bloodbath Explained: PB Fintech Crash, FII Shorts and Nifty Support
- Nifty Crash 2026: What Triggered the Sell-Off and Could 22,300 Be Next?