
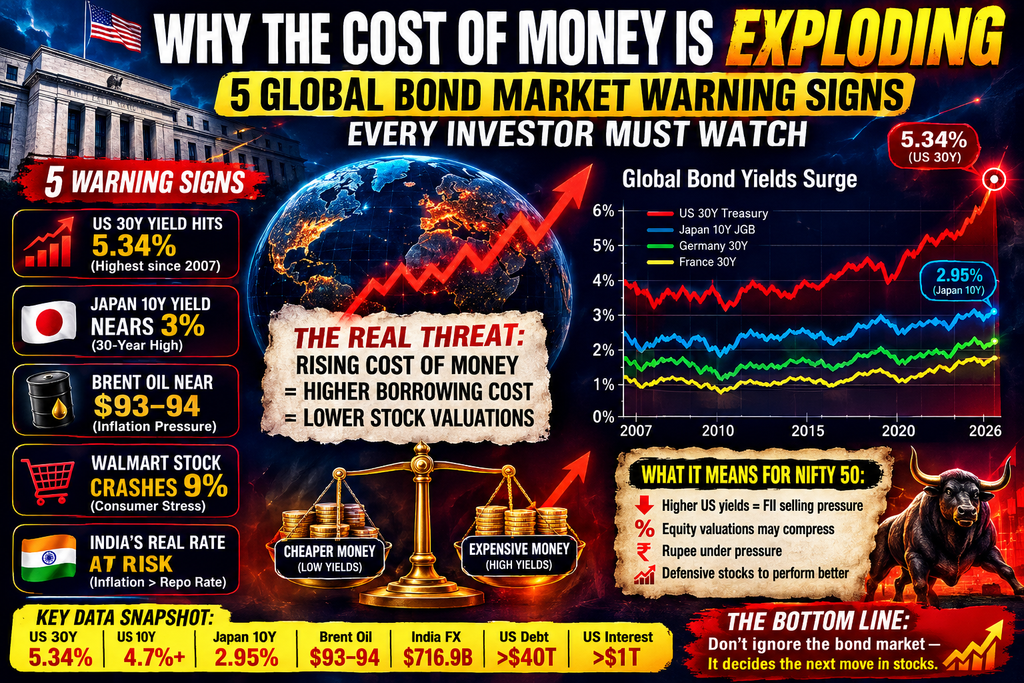
Introduction: The Quiet Signal Before the Storm
Stock markets usually get all the attention.
Nifty moves 300 points, Nasdaq falls 2%, an AI stock jumps 10%—and financial media immediately starts explaining what happened.
But beneath the equity market is a much larger and more important market:
The global bond market.
And right now, the bond market is sending a warning that equity investors cannot afford to ignore.
The 30-year U.S. Treasury yield recently reached 5.34%, its highest level since 2007. The U.S. 10-year yield moved close to 4.75%. At the same time, Japan’s 10-year government bond yield approached 3%, reaching its highest level since 1996. European government bond yields have also moved to multi-year or multi-decade highs.
This is more than a bond-market story.
It is a story about the price of capital.
And when the cost of capital rises, almost every financial asset eventually has to adjust.
1. Warning Sign: The Global Bond Market Is Breaking Higher
The first warning is the sheer synchronization of the move.
This is not just a U.S. phenomenon.
Recent long-term yield signals
| Market | Recent Signal | Why It Matters |
|---|---|---|
| 🇺🇸 U.S. 30Y Treasury | ~5.34% | Highest since 2007 |
| 🇺🇸 U.S. 10Y Treasury | ~4.7%+ | Higher global discount rate |
| 🇯🇵 Japan 10Y JGB | ~2.95% | Highest since 1996 |
| 🇫🇷 France 30Y | ~4.86% | Highest since 2008 |
| 🇩🇪 Germany 10Y | ~3.27% | Near multi-year highs |
| 🇬🇧 UK 30Y | ~5.8% | Elevated long-term borrowing cost |
Recent reporting shows that government borrowing costs across major economies have climbed sharply amid concerns about inflation, fiscal deficits, energy prices and rising government debt.
This creates an important macroeconomic question:
Who will finance all this government debt—and at what interest rate?
The answer determines the future cost of money.
2. The U.S. 5% Bond Yield Is a Global Warning
The U.S. Treasury market is the foundation of global finance.
When the 30-year Treasury yield rises above 5%, it changes the mathematics of investment.
Why would an institution take substantial equity risk if the risk-free rate has become significantly more attractive?
This doesn’t mean stocks automatically crash.
But it means their required return increases.
And that affects valuations.
Recent Treasury-market stress has been driven by a combination of inflation concerns, huge fiscal deficits, increasing government borrowing and uncertainty about future monetary policy. The U.S. federal debt has surpassed $40 trillion, while annual interest costs have risen above $1 trillion.
That creates a difficult feedback loop:
Higher debt → higher interest expense → greater borrowing requirements → more bond supply → higher required yields.
If investors start demanding a larger term premium, the government must pay even more to borrow.
3. Warning Sign: Japan Is No Longer the Low-Yield Anchor
Japan deserves special attention.
For decades, Japanese government bonds were synonymous with extremely low yields.
That world is changing.
Japan’s 10-year government bond yield recently reached approximately 2.945%, the highest level since September 1996.
Why is this important for global investors?
Because Japanese investors are major participants in global bond markets.
If domestic Japanese bonds become significantly more attractive, Japanese capital can potentially become less willing to chase foreign bonds.
That can create pressure on:
- U.S. Treasuries
- European government bonds
- Emerging-market debt
- Global equity valuations
- Currency markets
Japan’s fiscal position makes the development even more important. Reuters reported that Japan’s government is considering raising its assumed interest rate for debt-servicing calculations to 3.8%, the highest assumption in 29 years.
The old global model was:
Japan → cheap money → global capital flows
The new model could increasingly become:
Higher Japanese yields → repatriation pressure → tighter global financial conditions
That is a structural shift worth watching.
4. Warning Sign: Oil Is Feeding the Bond Market Problem
The bond-market selloff is not happening in isolation.
Energy prices are adding another layer of pressure.
Brent crude recently climbed toward $94 per barrel, with geopolitical tensions and uncertainty around the Middle East contributing to the move.
Higher oil creates a difficult policy combination:
Oil ↑
↓
Inflation expectations ↑
↓
Central banks become more cautious
↓
Long-term yields ↑
↓
Equity valuations ↓
This is particularly dangerous because oil is both an inflation shock and a consumer-income shock.
Consumers spend more on fuel.
They then have less money available for:
- Restaurants
- Entertainment
- Travel
- Consumer electronics
- Clothing
- Discretionary goods
That brings us to the next warning signal.
5. Warning Sign: Walmart Is Flashing a Consumer Alert
One of the most interesting developments recently came from an unexpected place:
Walmart.
Walmart shares fell roughly 9% after the company reported its slowest U.S. comparable-sales growth in six years. U.S. comparable sales increased only 2.6%, below the market expectation of around 3.8%.
The interesting part was not simply the stock-price decline.
It was the explanation.
Walmart executives pointed to higher fuel prices and consumers making spending trade-offs.
The company also estimated approximately $2 billion in additional fuel-related costs versus its original expectations.
This creates an important macro signal.
The consumer may not be collapsing.
But consumers may be becoming more selective.
And that distinction matters.
A consumer can remain employed and financially stable while still reducing discretionary spending.
That is often how economic pressure begins.
6. The Valuation Mathematics: Why Stocks Become More Expensive
This is where the bond market directly enters the equity market.
Imagine a company expected to generate ₹100 of cash flow several years from now.
If the discount rate is low, that future cash flow has a relatively high present value.
If the discount rate rises, the present value falls.
In simplified form:
Present Value = Future Cash Flow ÷ (1 + Discount Rate)ⁿ
Therefore:
Discount rate ↑ → Present value ↓
This is why high-growth stocks can be particularly sensitive to rising bond yields.
The impact is strongest on companies where a large portion of their valuation depends on profits expected many years into the future.
This is one reason why:
- AI stocks
- Technology companies
- High-growth startups
- Unprofitable growth companies
- Highly leveraged businesses
can experience larger valuation adjustments when long-term yields rise.
It is not necessarily because the businesses suddenly became bad.
The discount rate changed.
7. India’s Situation Is More Complicated
India is not simply following the U.S.
India has its own monetary policy, domestic liquidity, growth cycle and inflation dynamics.
The current RBI policy repo rate is 5.25%. RBI data also shows the Indian 10-year government bond and longer maturity securities trading at substantially higher yields than the policy rate.
That creates an important question:
What happens if global inflation rises while India is trying to maintain lower borrowing costs?
The RBI could face a difficult policy trade-off.
If inflation accelerates:
Inflation ↑ → rate-cut expectations ↓ → bond yields ↑
But if economic growth weakens simultaneously:
Growth ↓ → rate-cut pressure ↑
This creates a policy dilemma.
The RBI’s recent policy discussion has also been interpreted as more hawkish than the initial headline suggested, with members emphasizing inflation risks and the possibility of policy recalibration if price pressures intensify.
8. A Crucial Correction: India’s Real Rate Is Not Simply “Negative”
One common narrative circulating in the market is:
“Repo rate is 5.25% while inflation is above 5.25%, therefore India’s real policy rate is negative.”
That conclusion cannot be made using an arbitrary future inflation projection.
The correct calculation should use a consistent inflation measure and period.
For example:
Real policy rate ≈ Nominal policy rate − Inflation
But the relevant inflation number depends on whether we are using:
- Current CPI
- Average CPI
- Forward inflation expectation
- Core inflation
- Headline inflation
Therefore, investors should not automatically label India’s real rate negative simply because a projected inflation number is higher than the repo rate.
The bigger issue is where inflation is heading.
If energy prices remain elevated and inflation expectations become unanchored, the RBI’s room for aggressive easing becomes smaller.
9. India’s Rupee: A Better Way to Look at the Risk
The original argument that RBI reserves are simply “borrowed money” is too simplistic.
India’s foreign-exchange reserves are primarily reserve assets accumulated through the balance of payments and central-bank operations; they should not be described simply as “borrowed capital.”
In fact, India’s foreign-exchange reserves recently reached approximately $716.9 billion for the week ended August 14, according to official RBI data reported by the Economic Times.
However, a large reserve stock does not mean the RBI can defend any exchange-rate level indefinitely.
The better question is:
How expensive would persistent currency intervention become?
If:
Oil ↑
- U.S. yields ↑
- Dollar ↑
- FII outflows ↑
then pressure on the rupee can increase.
A weaker rupee can then feed back into imported inflation, especially through energy.
That creates another loop:
Rupee ↓ → imported inflation ↑ → RBI flexibility ↓ → bond yields ↑
10. Warning Sign: The MTM Risk in Bonds
There is another risk hiding inside the banking and financial system:
Mark-to-Market losses.
Bond prices and bond yields move in opposite directions.
Yield ↑ → Bond Price ↓
Banks, insurers, mutual funds and other financial institutions can hold significant quantities of government securities.
When yields rise, the market value of those securities falls.
However, this does not mean every fall in bond price immediately becomes a bank capital loss.
Accounting treatment matters.
Securities classified under different investment categories—such as held-to-maturity portfolios—can have different accounting treatment from securities held for trading or available for sale.
So the real risk is not:
“Bond yields rise = every bank immediately loses capital.”
The real risk is:
Rapid yield increases + forced selling + liquidity stress + inadequate hedging can transform market losses into broader financial stress.
That is a much more important scenario.
11. Why This Feels Like 2008—But Isn’t 2008 Yet
Comparisons with 2008 are tempting.
But they need to be handled carefully.
The current market is not automatically a repeat of the Global Financial Crisis.
The key difference is that today’s warning is primarily centered around:
- Sovereign debt
- Fiscal deficits
- Inflation
- Energy prices
- Term premiums
- Government refinancing
- Long-duration asset valuations
rather than the same type of private-sector credit collapse that triggered the 2008 crisis.
Nevertheless, the mechanism can become dangerous if multiple problems appear simultaneously.
The dangerous chain would be:
Bond yields ↑
↓
Bond prices ↓
↓
Financial-sector losses ↑
↓
Credit conditions tighten
↓
Corporate refinancing becomes expensive
↓
Economic growth slows
↓
Equity earnings expectations fall
↓
Stock valuations compress
That is the scenario investors need to monitor.
12. The U.S. Treasury Buyback Is Not a Magic Solution
The recent Treasury intervention makes this story even more interesting.
After long-term Treasury yields surged, the U.S. Treasury increased its planned support for longer-dated securities, with the maximum size of certain buyback operations raised to at least $4 billion per operation.
The initial market reaction was positive.
Long-term yields temporarily fell.
But the relief did not completely solve the underlying problem.
Reuters reported that yields rose again after the initial announcement, highlighting persistent concerns about inflation and the U.S. government’s debt burden.
This is the key distinction:
Liquidity support can reduce market stress.
But:
Liquidity support cannot permanently eliminate fiscal risk.
The Treasury can improve market functioning.
It cannot make a $40+ trillion debt burden disappear.
13. Five Bond-Market Warning Signals Investors Should Track
Rather than watching headlines, investors can monitor five measurable signals.
Signal 1: U.S. 30-Year Treasury
Below 5%
Potential relief.
5%–5.3%
High-risk zone.
Above 5.3% with momentum
Serious warning for long-duration assets.
The recent peak around 5.34% shows the market is already testing this zone.
Signal 2: Japan 10-Year Yield
The 2.95% area is now a critical psychological level.
A sustained move toward or above 3% could increase pressure on Japanese monetary policy and global capital flows.
Signal 3: Brent Crude
Oil approaching or remaining above $90 increases the probability of persistent inflation pressure.
If crude moves substantially higher, bond markets may begin pricing a longer period of restrictive monetary policy.
Signal 4: Treasury Auction Demand
Investors should monitor:
- Bid-to-cover ratio
- Tail
- Foreign participation
- Dealer allocation
- Yield concession
The critical question isn’t simply:
“Did the auction succeed?”
It is:
“How much yield did investors demand to absorb the debt?”
Signal 5: FII Flows Into India
For Indian investors, this is critical.
A sustained combination of:
U.S. yields ↑
- Dollar ↑
- FII selling ↑
- Rupee ↓
can create significant pressure on Nifty.
Conversely, if U.S. yields stabilize and FII shorts begin unwinding, Indian equities could receive a relief boost.
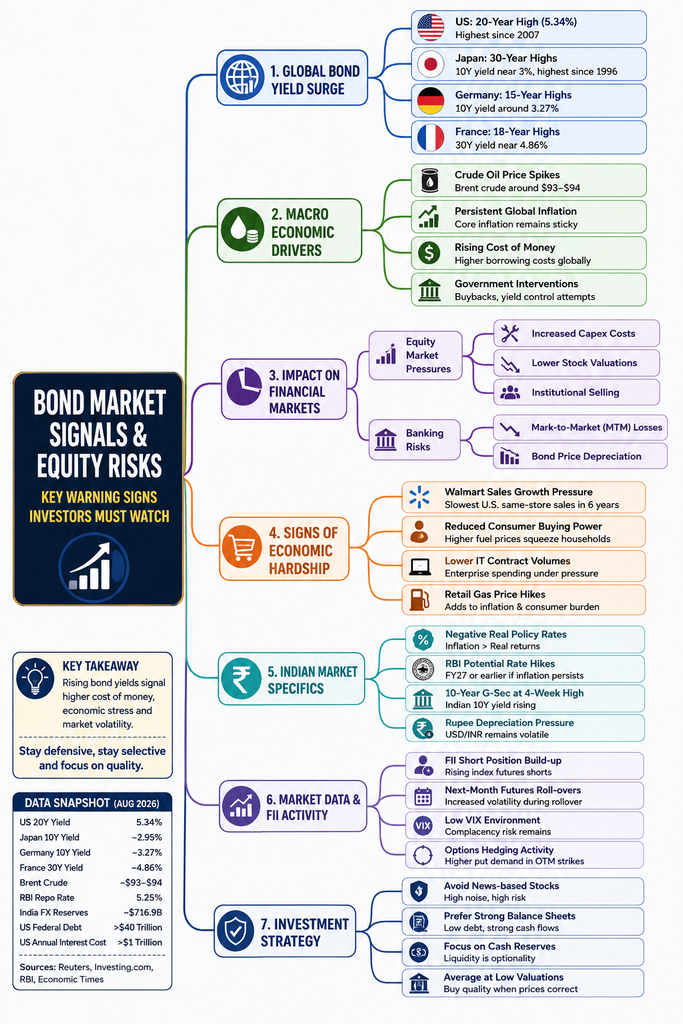
14. What This Means for Nifty 50
The biggest mistake would be assuming:
“Bond yields are rising, so Nifty must crash.”
Markets are more complicated than that.
India can outperform global markets even during periods of global bond stress if domestic earnings, liquidity and economic growth remain strong.
But the risk-reward equation changes.
Nifty becomes more vulnerable when:
- U.S. 30Y remains above 5%
- Brent stays above $90
- USD/INR weakens
- FII selling accelerates
- Indian bond yields rise
- Corporate earnings expectations fall
- Global technology stocks correct
Nifty becomes stronger when:
- U.S. yields stabilize
- Oil falls
- Dollar weakens
- FII selling reverses
- Domestic liquidity remains strong
- Earnings estimates rise
Therefore, investors should stop viewing Nifty in isolation.
Nifty is increasingly a function of global liquidity + domestic earnings.
15. Bull Case vs Bear Case
| Factor | Bullish Outcome | Bearish Outcome |
|---|---|---|
| U.S. 30Y | Falls below 5% | Sustains above 5.3% |
| Japan 10Y | Stabilizes | Moves toward/above 3% |
| Oil | Falls below $90 | Moves substantially above $90 |
| Inflation | Cools | Reaccelerates |
| RBI | More flexibility | More hawkish |
| FII | Buying / short covering | Persistent selling |
| Rupee | Stabilizes | Weakens sharply |
| Nifty | Breakout | Valuation compression |
| Growth stocks | Recover | Underperform |
| Bond market | Stabilizes | Disorderly selloff |
16. The Investor’s Survival Strategy
The answer is not to sell everything.
It is to understand what kind of assets are most vulnerable when the cost of money rises.
1. Prioritize Strong Balance Sheets
Look for companies with:
- Low net debt
- Strong operating cash flow
- High interest coverage
- Stable margins
- Consistent ROCE/ROE
- Sustainable competitive advantages
2. Be Careful With “Future Promise” Stocks
The higher the valuation and the further away the expected cash flows, the more sensitive the stock can be to discount-rate changes.
A company doesn’t need to be bad to become a bad investment.
Price matters.
3. Watch Debt More Closely
In a low-rate environment, high debt can look manageable.
In a high-rate environment, refinancing becomes expensive.
Ask:
What happens to this company’s earnings if borrowing costs rise another 2%?
That question can reveal hidden balance-sheet risk.
4. Keep Some Liquidity
Cash is not exciting.
But optionality is valuable during market corrections.
When high-quality assets become cheaper, investors with liquidity have choices.
Investors fully invested at the top have fewer.
17. The Real Question Isn’t “Will Bonds Crash?”
The more important question is:
“How high does the cost of money need to go before something breaks?”
That “something” could be:
- A government bond market
- A currency
- A bank balance sheet
- A leveraged company
- A consumer
- A property market
- An expensive technology sector
We don’t know which link would break first.
And that is exactly why the bond market deserves attention.
Conclusion: The Bond Market Is the Real Early-Warning System
The equity market tells you what investors are buying today.
The bond market often tells you what investors are demanding for the future.
Right now, the message is uncomfortable.
The U.S. 30-year Treasury yield has reached 5.34%, Japan’s 10-year yield has approached 3%, European borrowing costs have climbed sharply, oil has moved toward the mid-$90s, and the U.S. government is dealing with debt above $40 trillion and annual interest costs above $1 trillion.
At the same time, consumer-sensitive companies such as Walmart are showing signs that elevated fuel costs are forcing households to make spending trade-offs.
None of this guarantees a financial crisis.
But it does tell us that the ultra-cheap-money era cannot be taken for granted.
The next phase of the market may be determined not by how much money investors can borrow, but by how much they are willing to pay for it.
And that is why the most important chart for investors may not be the Nifty chart.
It may be the 30-year U.S. Treasury yield.
The final question for every investor:
Is your portfolio strong enough to survive if the cost of money stays high for longer than the market expects?
Because if the answer is no, the next bond-market shock could expose the weakness before the equity market has time to warn you.
Key Data Snapshot
| Indicator | Recent Level / Signal |
|---|---|
| 🇺🇸 U.S. 30Y Treasury | ~5.34% peak |
| 🇺🇸 U.S. 10Y Treasury | ~4.7%+ |
| 🇯🇵 Japan 10Y JGB | ~2.945% |
| 🇮🇳 RBI Repo Rate | 5.25% |
| 🇮🇳 India FX Reserves | ~$716.9B |
| 🛢️ Brent Crude | ~$93–94 |
| 🇺🇸 U.S. Federal Debt | >$40T |
| 🇺🇸 U.S. Annual Interest Cost | >$1T |
| 🛒 Walmart Stock Reaction | ~9% fall |
| 🇺🇸 Walmart U.S. Comparable Sales | +2.6% |
Sources: U.S. Treasury, Federal Reserve/RBI data and recent Reuters reporting.
Disclaimer: This article is for educational and informational purposes only and is not investment advice. Market conditions can change rapidly, and investors should conduct their own research before making investment decisions.
Top 10 SEO Titles
- Why the Cost of Money Is Exploding: 5 Global Bond Market Warning Signs
- Global Bond Market Crisis 2026: 5 Warning Signs Every Investor Must Watch
- Bond Yields Are Exploding: Why the Global Cost of Money Could Hit Stocks
- The Global Bond Market Warning: Why Rising Yields Could Crush Stock Valuations
- US Bond Yields Above 5%: The Hidden Risk Facing Nifty 50 and Global Markets
- Why Global Bond Yields Are Rising: Oil, Inflation, Debt and the Next Market Shock
- Global Debt Crisis 2026: Why Rising Bond Yields Are Changing the Stock Market
- The 5% Bond Yield Shock: Why Investors Should Fear the Rising Cost of Money
- Nifty 50 Warning: How Rising US Bond Yields Could Trigger FII Selling
- Is the Era of Cheap Money Over? 5 Global Bond Market Signals Investors Can’t Ignore