
Introduction: Is the Market Rally a Genuine Recovery or Just Temporary Relief?
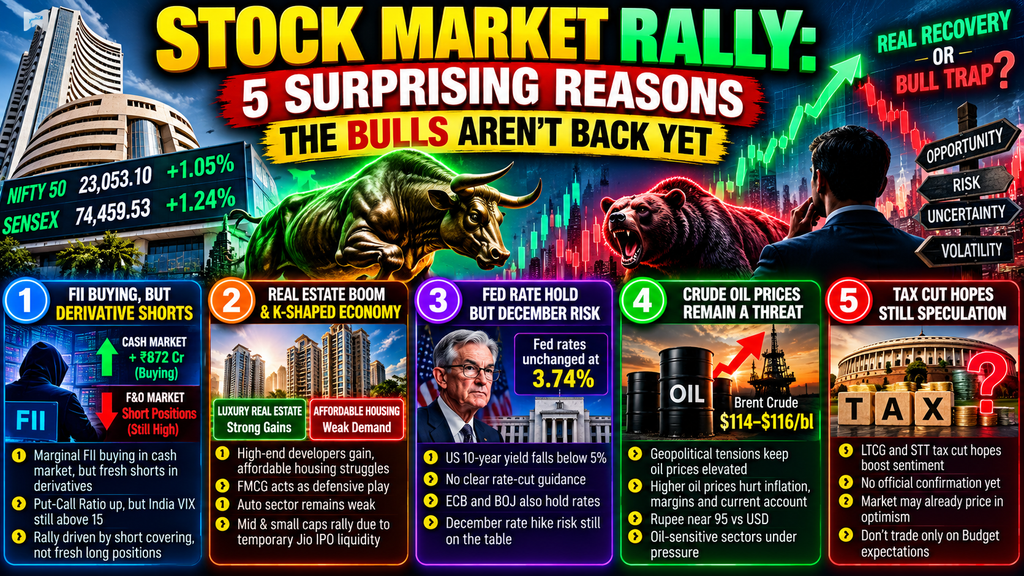
The Indian stock market delivered a strong rebound on October 29, 2026, after a period of selling pressure. The Nifty 50 gained 237.90 points, or 1.05%, to close at 22,936.75, while the Sensex advanced 905.01 points, or 1.24%, to finish at 74,151.04.
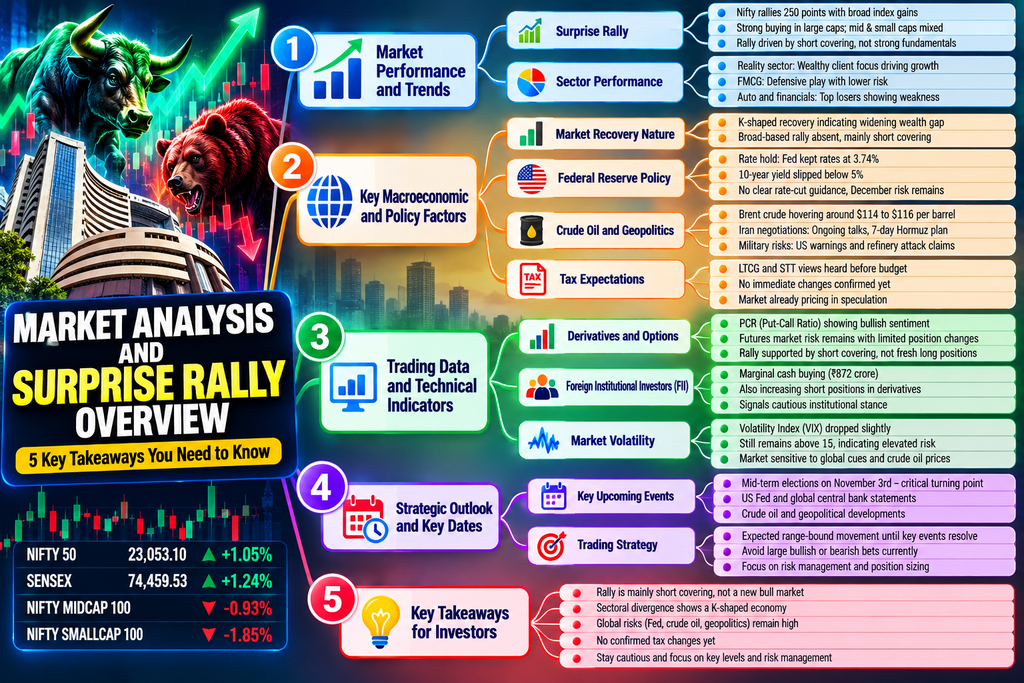
The positive momentum continued on October 30. The Nifty 50 closed at 23,053.10, gaining another 116.35 points, while the Sensex rose 308.49 points to 74,459.53.
The recovery followed the US Federal Reserve’s decision to maintain interest rates and encouraging corporate earnings. However, weakness in broader market indices and concerns about elevated crude oil prices suggest that the recovery may not be equally strong across all market segments.
For retail investors, the important question is not simply whether the market is rising. It is whether the rally is supported by sustainable earnings growth, broad-based buying and improving economic conditions.
Here are five important realities investors should understand before assuming that a new bull market has begun.
1. FII Cash-Market Buying Does Not Automatically Mean Bullish Positioning
Foreign Institutional Investors (FIIs), also known as Foreign Portfolio Investors in many market reports, play an important role in Indian equity markets.
On October 28, FIIs were net buyers in the cash market by approximately ₹872 crore. This initially appeared encouraging, particularly when combined with the market’s subsequent rebound.
However, the picture changed on October 29.
| Institutional Activity | October 28, 2026 | October 29, 2026 |
|---|---|---|
| FII cash-market activity | +₹871.83 crore | -₹943.60 crore |
| DII cash-market activity | +₹643.35 crore | +₹1,924.41 crore |
| Nifty 50 closing level | 22,698.85 | 22,936.75 |
Source: Published institutional flow data. Positive figures indicate net buying; negative figures indicate net selling.
These figures highlight an important point: institutional sentiment can change from one session to another.
Why Should Traders Watch the Derivatives Market?
Cash-market activity tells investors whether institutions are buying or selling shares. Index futures, options, and open interest provide additional information about their exposure and hedging activity.
Traders should examine:
- Index futures positioning: Are institutional participants increasing long exposure or maintaining short positions?
- Open interest: Is rising open interest accompanying an advance or a decline in the index?
- Put-Call Ratio (PCR): Is options positioning becoming more bullish or bearish?
- India VIX: Is expected market volatility declining or increasing?
- Price and volume: Is the rally supported by sustained buying or fading momentum?
No single indicator provides a complete picture. A rising index alongside fresh futures shorts may indicate hedging or bearish positioning, but it does not automatically prove that the rally is a trap.
Investor takeaway: Avoid interpreting one day’s FII buying as confirmation of a sustained institutional shift toward bullish equities. Combine cash flows with derivatives data, price action and follow-through buying.
2. Sectoral Divergence May Reveal a K-Shaped Economic Recovery
A rising benchmark index does not mean that every company, sector or consumer group is benefiting equally.
A K-shaped recovery describes a situation in which different parts of the economy move in opposite directions. Some businesses experience strong growth while others struggle with weak demand, higher costs or reduced purchasing power.
This framework can help investors understand why market performance may differ significantly between sectors.
Why Sector Performance Matters
Real estate: Investors should distinguish between premium residential developers, affordable housing companies and commercial property businesses. Their customer profiles, margins and demand drivers can be very different.
FMCG: Consumer-staples companies can sometimes offer relative defensiveness when economic uncertainty rises. However, weak volume growth, input costs and valuation also matter.
Automobiles: Vehicle sales, financing costs, fuel prices and consumer confidence can influence performance across different automobile segments.
Banking: Credit growth, deposit costs, asset quality and loan demand are more useful indicators of banking-sector strength than the index’s daily movement alone.
The broader market provided an important warning on October 30. While the Nifty 50 and Sensex finished higher, the Nifty Midcap 100 fell approximately 0.93%, and the Nifty Smallcap 100 declined around 1.85%. This divergence suggests that the benchmark recovery was not matched by equally strong participation across smaller companies.
What Does This Mean for Investors?
Investors should not assume that a benchmark rally represents a broad improvement in corporate earnings or economic demand.
Instead, examine:
- Sector-wise returns over multiple sessions.
- Earnings growth compared with share-price appreciation.
- Revenue growth and profit margins.
- Market breadth and the number of stocks participating in the rally.
- Whether mid-cap and small-cap stocks confirm the benchmark’s upward trend.
Investor takeaway: A sustainable recovery generally becomes more convincing when market breadth improves,s and multiple sectors participate. A rally concentrated in a few large stocks deserves closer examination.
3. The Federal Reserve’s Rate Pause Is Not a Guarantee of Lower Interest Rates
Global monetary policy remains an important driver of emerging-market capital flows.
On October 28, 2026, the US Federal Reserve maintained its target range for the federal funds rate at 3.75%–4.00%. The decision provided some relief to investors concerned about the cost of borrowing and global financial conditions.
However, the Federal Reserve also noted that inflation remained elevated and uncertainty persisted. Two members dissented in favour of a 0.25-percentage-point rate increase. The decision therefore should not be interpreted as an unconditional signal that rate cuts are imminent.
How Can US Interest Rates Affect Indian Equities?
There are several transmission channels.
1. Foreign capital flows
Higher US yields can make dollar-denominated assets relatively attractive. Depending on valuations, currency expectations and risk appetite, this can reduce demand for emerging-market equities.
2. Currency movements
Changes in the dollar can affect the Indian rupee. A weaker rupee may benefit some export-oriented businesses while increasing the cost of imported commodities and equipment.
3. Valuation multiples
Growth stocks often depend heavily on expectations about future earnings. Changes in interest rates and discount rates can affect how investors value those expected earnings.
4. Global risk appetite
Monetary policy interacts with geopolitical tensions, corporate earnings and liquidity conditions. Consequently, a rate pause does not guarantee that global investors will become more willing to take risks.
What Should Traders Watch Next?
Monitor the Federal Reserve’s subsequent statements, US Treasury yields, the dollar index, USD/INR and foreign portfolio investment flows.
Do not assume that the Fed will raise or cut rates at its next meeting without supporting official guidance.
Investor takeaway: A rate pause can support sentiment, but sustained market strength requires more than a single central-bank announcement.
4. High Crude Oil Prices Remain a Risk for the Indian Economy
Crude oil is one of the most important external variables for Indian financial markets because India imports a substantial proportion of its oil requirements.
During October 2026, geopolitical tensions in the Middle East kept energy-market risks elevated. Brent crude traded around $114–$116 per barrel during parts of the period, although prices varied across sessions.
Even when diplomatic discussions create hopes of de-escalation, investors should distinguish between political announcements and actual changes in physical oil supply.
Why Does Expensive Oil Matter?
Inflation: Higher energy costs can feed into transportation, manufacturing and other business expenses.
Corporate margins: Airlines, paints, chemicals, logistics and other oil-sensitive industries may face margin pressure when costs rise faster than selling prices.
Current account: A higher oil-import bill can put pressure on India’s external balances.
Currency: If higher oil prices increase dollar demand, the rupee may face additional pressure, although currency movements also depend on capital flows, monetary policy and global dollar strength.
Interest rates: Persistent energy-driven inflation can complicate the policy decisions facing central banks.
Is a Diplomatic Announcement Enough to Turn Bullish?
Not necessarily.
A credible and sustained reduction in geopolitical risk could lower the oil risk premium. However, investors should look for confirmation through actual crude prices, shipping conditions, supply developments and changes in market expectations.
A headline about peace negotiations does not by itself establish that oil supply risks have disappeared.
Who Should Be Particularly Careful?
Investors should pay close attention to:
- Airlines and fuel-sensitive transport companies.
- Paint and chemical manufacturers.
- Oil marketing companies.
- Energy-intensive industrial businesses.
- Companies with substantial imported input costs.
The impact differs by business model. Higher crude prices can benefit some upstream energy producers while hurting other industries.
Investor takeaway: Track Brent crude alongside the Nifty, the rupee and sector performance. A sustained increase in oil prices could limit the upside from an otherwise positive equity-market environment.
5. LTCG and STT Tax-Cut Hopes Are Not the Same as an Approved Policy Change
Long-Term Capital Gains (LTCG) tax and Securities Transaction Tax (STT) influence the cost of investing and trading in Indian equities.
Expectations about possible tax changes can influence market sentiment, particularly before the Union Budget. However, investors should distinguish between market speculation, official consideration, and an implemented policy decision.
Reports of potential LTCG tax relief contributed to investor sentiment during the late-October recovery. That does not establish that a tax cut has been approved or that a particular change will be included in the next Budget.
Why Should Investors Avoid Trading on Unconfirmed Tax Rumours?
There are three main reasons.
1. Policy expectations can change
A proposal discussed by market participants may not become an official government decision.
2. The market may already have priced in the rumour
If a stock or index rises in anticipation of a tax cut, the eventual announcement may produce a smaller gain than expected—or even a sell-off if the outcome disappoints investors.
3. Tax policy is only one part of the investment equation
Corporate earnings, valuations, foreign capital flows, crude oil and global monetary policy can have a greater influence on share prices over longer periods.
What Should Investors Do?
Before acting on a tax-related headline, check official government announcements, Budget documents and relevant notifications.
Do not buy stocks solely because of an unconfirmed expectation that LTCG or STT will be reduced.
Investor takeaway: Treat tax-cut speculation as a possible sentiment driver, not as a confirmed investment catalyst.
Nifty 50 Technical Outlook: Levels Traders Should Monitor
The Nifty 50 closed at 23,053.10 on October 30, 2026, extending its recovery for a second consecutive session. The index’s return above 23,000 is encouraging, but the next move will depend on whether buying continues and the broader market begins to participate.
Technical levels should be calculated from the latest chart rather than copied mechanically from an earlier market session.
| Technical Factor | What Traders Should Watch |
|---|---|
| Immediate resistance | The recent swing high and subsequent rejection zone |
| Breakout confirmation | A sustained move above resistance, preferably supported by volume and market breadth |
| Immediate support | The latest confirmed swing low or breakout-retest zone |
| Breakdown confirmation | A decisive move below support followed by continued selling |
| Market breadth | Whether mid-cap and small-cap stocks begin confirming the benchmark’s rise |
| Volatility | Whether India VIX and intraday price swings remain elevated |
Bullish Scenario
A more convincing bullish setup would involve the Nifty holding above its reclaimed levels, breaking through nearby resistance and attracting participation from multiple sectors.
Traders should look for follow-through buying rather than treating a single green candle as sufficient confirmation.
Bearish Scenario
The recovery could weaken if the index fails near resistance, market breadth deteriorates further, or rising crude oil prices increase pressure on risk assets.
A breakdown below a confirmed support level, accompanied by strong selling volume, would strengthen the bearish case.
Range-Bound Scenario
If the index repeatedly moves between support and resistance without sustained follow-through, a range-bound market may remain the most practical interpretation.
In such conditions, position sizing and disciplined stop-loss placement become especially important.
Important: These are conditional scenarios, not guaranteed predictions. Confirm exact support and resistance levels using the current Nifty chart before entering a trade.
Investor Strategy: How to Navigate a Volatile Market
The most effective response to an uncertain rally is not to predict every market move. It is to establish a process for managing risk.
1. Avoid Chasing a Sudden Rally
Do not buy simply because the index has moved sharply higher. Evaluate the entry price, nearby resistance, stop-loss distance, and potential reward.
2. Confirm Institutional Participation
Review cash-market flows and derivatives positioning together. Neither FII cash data nor futures open interest should be interpreted in isolation.
3. Focus on Earnings Quality
Prefer businesses with credible revenue growth, manageable debt, healthy cash flows and reasonable valuations. A strong market cannot permanently compensate for weak business fundamentals.
4. Control Position Size
Decide the maximum acceptable loss before entering a trade.
For example, with trading capital of ₹10,000, a risk limit of 1% equals ₹100 per trade. A 2% limit equals ₹200. These are illustrative risk limits, not a promise that actual losses will remain within that amount if a position gaps through its stop-loss.
5. Be Careful With Leverage
Futures and options can magnify losses, particularly during geopolitical announcements, volatile sessions,s and sudden changes in implied volatility.
Avoid increasing position size merely to recover an earlier loss.
6. Separate Trading From Investing
Short-term market sentiment can change rapidly. Long-term investment decisions should instead consider business quality, valuation, financial strength,th and investment time horizon.
Frequently Asked Questions (FAQs)
1. Why did the Indian stock market rise on October 29, 2026?
The rebound followed the US Federal Reserve’s decision to hold interest rates steady and encouraging corporate earnings. These developments supported sentiment after a period of weakness in Indian equities.
2. Does FII buying mean the Nifty will rise?
No. FII cash-market buying is one indicator among many. Derivatives exposure, domestic institutional flows, corporate earnings, valuations and global developments can all affect the Nifty’s direction.
3. What is short covering in the stock market?
Short covering occurs when traders close existing short positions by buying back the securities or derivatives they previously sold. This buying can accelerate a market rebound, but it does not necessarily indicate that a lasting bullish trend has begun.
4. How do crude oil prices affect Indian stocks?
Higher oil prices can increase inflation and operating costs for oil-sensitive businesses while putting pressure on India’s import bill. The impact varies across sectors, with some energy producers potentially benefiting.
5. Is a Federal Reserve rate pause bullish for Indian markets?
It can support sentiment, but the impact depends on the accompanying policy guidance, inflation outlook, Treasury yields, dollar movements and foreign investment flows. A rate pause does not guarantee a sustained rally.
6. Are LTCG and STT tax cuts confirmed?
Investors should not treat market speculation as an approved policy change. Check official government announcements and Budget documents before making investment decisions based on tax expectations.
7. How can traders confirm a genuine Nifty breakout?
Look for a sustained move above a clearly identified resistance level, healthy volume, improving market breadth, and follow-through buying. No single indicator can guarantee that a breakout will succeed.
Conclusion: A Rally Is a Signal to Investigate, Not a Reason to Abandon Risk Management
The late-October rebound in Indian equities has provided relief after a period of market weakness. The Nifty 50 and Sensex both advanced on October 29 and October 30, supported by the Federal Reserve’s rate decision and corporate earnings.
Nevertheless, the wider picture remains mixed. Foreign institutional flows have been inconsistent, smaller-cap indices have weakened even as benchmarks advanced, and elevated crude oil prices continue to create uncertainty.
These conditions do not prove that the rally is artificial or that the market must fall. They indicate that investors should demand stronger confirmation before assuming that a sustained bull market has begun.
The key is to distinguish temporary momentum from durable improvement in earnings, liquidity and market participation.
The bottom line: Follow verified data, use clearly defined technical levels, maintain disciplined risk management and avoid making investment decisions based on unconfirmed rumours.
A successful investor does not need to predict every market move. The goal is to identify favourable opportunities while ensuring that one incorrect decision does not cause disproportionate damage to capital.
Disclaimer
This article is for educational and informational purposes only and should not be considered investment advice or a recommendation to buy or sell any security or derivative. Stock-market investments and derivatives trading involve risk, including the potential loss of capital. Readers should conduct independent research and consult a SEBI-registered investment adviser where appropriate before making investment decisions.
Top 10 SEO Titles
- Stock Market Rally: 5 Surprising Reasons the Bulls Aren’t Back Yet
- Indian Stock Market Analysis: 5 Hidden Risks Behind the Recent Rally
- Nifty 50 Rally Explained: Are Bulls Back or Is It a Bull Trap?
- Stock Market Rally 2026: FII Data, Crude Oil and Hidden Risks
- Nifty 50 Prediction: 5 Factors That Could Decide the Next Market Move
- Why Is the Indian Stock Market Rising? 5 Risks Investors Must Watch
- FII vs DII Data: What the Latest Market Rally Reveals About Investors
- Indian Stock Market Outlook 2026: Fed Rates, Oil Prices and FII Flows
- Is the Nifty Rally Sustainable? Key Signals Every Trader Should Watch
- Stock Market Crash or Recovery? 5 Signals Indian Investors Should Know