
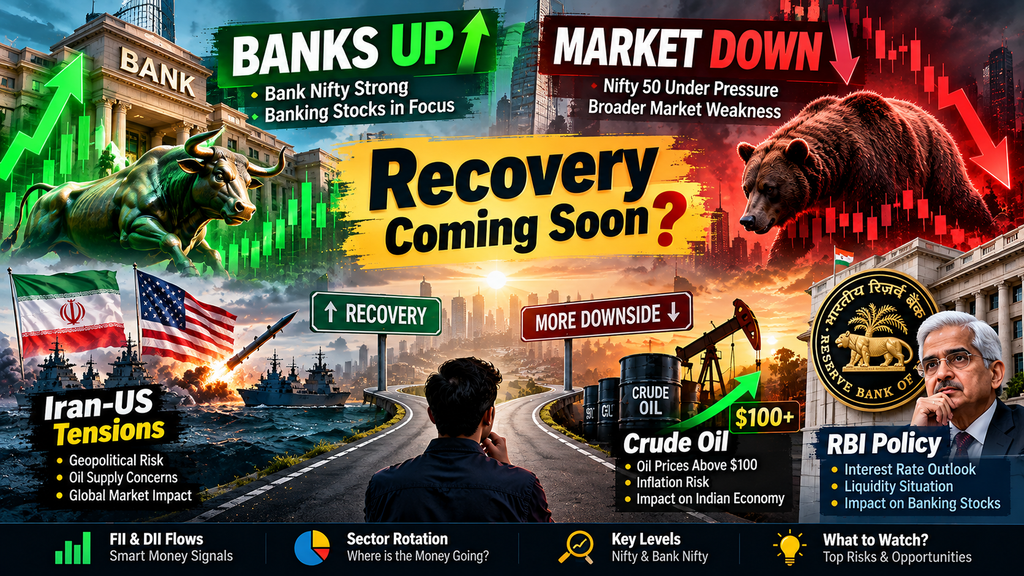
Introduction: Is the Indian Stock Market Preparing for a Recovery?
The Indian stock market can sometimes present a confusing picture. Banking stocks may show relative strength even as the broader market continues to decline. At the same time, geopolitical uncertainty, crude oil prices, foreign investor outflows, and monetary policy expectations can influence market sentiment.
This raises an important question: Is the Indian stock market preparing for a recovery, or could further downside risks remain?
To understand the market outlook, investors need to look beyond the daily movement of the Nifty 50 and Sensex. Bank Nifty performance, market breadth, Foreign Institutional Investor (FII) activity, Domestic Institutional Investor (DII) flows, crude oil prices, the Indian rupee and Reserve Bank of India (RBI) policy decisions are also important.
According to figures referenced in September 2026 market reports, the Nifty 50 experienced a significant monthly decline, while foreign investor outflows and elevated crude oil prices added to market uncertainty. These developments highlight the importance of monitoring both domestic and international factors.
This article examines the major factors influencing the Indian stock market, explains potential recovery signals, and outlines practical risk-management considerations for investors and traders.
1. Banks Up, Market Down: What Does It Mean?
One of the interesting situations in financial markets occurs when banking stocks rise while the broader market declines.
This divergence may indicate sector rotation, selective buying, short covering,g or differences in earnings expectations across industries.
For example, suppose Bank Nifty rises by 0.8% while the Nifty 50 falls by 0.6%. This would indicate relative strength in banking stocks, but it would not automatically confirm a broader market recovery.
Several factors can explain this divergence:
- Investors may be buying selected banking stocks while selling IT, automobile, FM, CG, or metal stocks.
- Institutional investors may be reallocating capital between sectors.
- Short covering may temporarily support banking stocks.
- Company-specific earnings expectations may differ across industries.
- Broader market weakness may outweigh gains in banking shares.
Bank Nifty vs Nifty 50
The Nifty Bank index tracks major banking stocks, whereas the Nifty 50 represents companies across several sectors of the Indian economy.
Investors should monitor the following indicators:
- Daily and weekly Bank Nifty price structure.
- Performance of private-sector and public-sector banks.
- Trading volumes and delivery activity.
- Advance-decline ratios across the market.
- Relative performance between Bank Nifty and Nifty 50.
Sustained strength across multiple trading sessions is generally more informative than a single positive session.
2. How to Identify Potential Stock Market Recovery Signals
A market recovery often begins with changes in price structure and investor participation. However, not every bounce after a decline becomes a sustainable upward trend.
Investors can evaluate several indicators together.
A. Nifty 50 Price Structure
A potential improvement in market structure may occur when the index stops making lower lows and starts forming higher lows.
A move above a previous swing high, followed by sustained trading above that level, may provide additional confirmation.
B. Market Breadth
Market breadth measures how many stocks are advancing compared with those declining.
If the Nifty 50 rises while most listed stocks continue to fall, the rally may be concentrated in a small number of large companies.
Broader participation across sectors can provide additional information about the strength of a recovery.
C. Volume Confirmation
Rising prices accompanied by increased trading volume may indicate stronger participation from buyers.
However, volume should be interpreted alongside price action, volatility,ity and market conditions rather than used as a standalone signal.
D. FII and DII Activity
Foreign Institutional Investors and Domestic Institutional Investors can influence market liquidity and sentiment.
Sustained foreign investor selling may create pressure, while domestic institutional buying can absorb some of that selling.
Nevertheless, institutional flows alone cannot reliably predict the direction of the market.
E. India VIX
India VIX measures the market’s expectation of near-term volatility derived from Nifty options prices.
A rising India VIX may indicate increasing uncertainty, while a declining reading may indicate easing volatility expectations. Neither movement guarantees a bullish or bearish market outcome.
Potential Recovery Checklist
| Indicator | What to Monitor |
|---|---|
| Nifty 50 | Higher lows and resistance breakouts |
| Bank Nifty | Sustained relative strength |
| Market breadth | Improvement in advancing stocks |
| Trading volume | Participation during upward moves |
| FII/DII flows | Changes in institutional buying and selling |
| India VIX | Volatility expectations |
| Crude oil | Stability in international prices |
| Corporate earnings | Changes in earnings expectations |
A combination of these indicators provides a more complete picture than relying on any single signal.
3. Smart Money Signals: How to Track Institutional Activity
The term “Smart Money” is commonly used to describe institutional investors, professional traders, and large market participants.
These investors may have access to extensive research, analytical resources and sophisticated risk-management systems. However, their activity does not guarantee that a particular stock or index will rise.
Several data points can help investors understand institutional positioning.
FII and DII Cash Market Data
Daily institutional activity provides information about net buying and selling in the cash market.
Investors should examine daily figures alongside weekly and monthly trends rather than focusing on a single session.
Bulk and Block Deals
Large transactions can reveal significant changes in share ownership. However, the purpose of a transaction may not always be clear from publicly available data.
Delivery Volume
Delivery activity can provide additional context about trading participation, particularly when combined with price movement and liquidity.
Futures and Options Open Interest
Changes in open interest may provide clues about derivatives positioning.
However, open interest alone does not establish whether institutional investors are bullish or bearish. It must be interpreted with price changes, volume, options positioning,g and other available information.
Sector Rotation
When certain sectors consistently outperform while others weaken, capital may be moving between different parts of the market.
Monitoring sector performance can help investors identify relative strength without assuming that a particular sector will continue outperforming.
4. Iran-US Tensions and Their Impact on the Indian Stock Market
Geopolitical developments can affect financial markets through energy prices, currency movements, inflation expectations, ns and changes in global risk appetite.
Tensions involving Iran and the United States can be particularly relevant to India because international crude oil prices influence the country’s import bill and domestic cost structure.
Potential market effects include:
- Higher crude oil prices.
- Increased uncertainty in global financial markets.
- Foreign capital outflows from emerging markets.
- Pressure on the Indian rupee.
- Higher inflation expectations.
- Changes in corporate earnings forecasts.
The actual market impact depends on the severity and duration of geopolitical developments, the response of energy markets, and the extent to which investors have already priced in the risk.
Which Sectors Could Be Affected?
Aviation: Higher jet fuel costs can put pressure on operating margins.
Paints and chemicals: Petroleum-linked raw materials can increase production costs.
Logistics and transportation: Higher fuel expenses can affect profitability.
Oil marketing companies: Changes in crude prices, retail fuel pricing and marketing margins can influence earnings.
Oil producers: Higher crude prices may support revenue, depending on production costs, taxation and contractual arrangements.
Banking: Higher inflation, currency volatility and economic uncertainty can indirectly affect credit demand and borrower repayment capacity.
Investors should avoid making trading decisions based solely on geopolitical headlines. Actual price reactions, company fundamentals and confirmed developments also matter.
5. Crude Oil Above $100: Why It Matters for India
India depends heavily on imported crude oil to meet its energy requirements. Consequently, a sustained increase in international oil prices can affect several areas of the economy.
Impact on Inflation
Higher oil prices can increase transportation, manufacturing, and logistics costs. Depending on how much of the increase is passed on to consumers, this may contribute to inflation.
Impact on the Indian Rupee
A larger oil import bill can increase demand for foreign currency. Other factors, including capital flows and global dollar strength, also influence the exchange rate.
Impact on Corporate Earnings
Companies with high fuel or petroleum-linked input costs may experience margin pressure if they cannot pass on higher expenses to customers.
Impact on Monetary Policy
Persistent inflationary pressure can complicate monetary policy decisions. The RBI must consider inflation, economic growth, liquidity, and financial stability when determining its policy approach.
Sector-Wise Impact of Rising Crude Oil Prices
| Sector | Potential Impact |
|---|---|
| Aviation | Higher fuel expenses |
| Paints | Increased raw material costs |
| Chemicals | Input cost pressure |
| Logistics | Higher transportation expenses |
| Oil producers | Potential revenue support |
| Oil marketing companies | Margins depend on pricing and policy |
| Banking | Indirect impact through inflation and credit conditions |
Investors should track Brent crude prices, USD/INR, inflation data and company earnings together to understand the broader implications.
6. RBI Monetary Policy and Banking Stocks
The Reserve Bank of India influences financial conditions through monetary policy, liquidity management and its broader regulatory framework.
Changes in policy rates can affect bank funding costs, lending rates, credit demand and net interest margins.
The impact is not identical across all banks because their deposit structures, loan portfolios and funding requirements differ.
What Happens When Interest Rates Rise?
Higher interest rates may:
- Increase the cost of deposits and other funding.
- Affect loan demand.
- Increase borrowing costs for some businesses and households.
- Put pressure on interest-sensitive sectors.
- Help moderate inflation, depending on the strength of monetary transmission.
What Happens When Interest Rates Fall?
Lower interest rates may:
- Reduce borrowing costs.
- Support credit demand.
- Benefit certain interest-sensitive sectors.
- Change the relative attractiveness of deposits and bonds.
- Affect bank margins depending on how quickly lending and deposit rates adjust.
A rate cut is not automatically bullish for banking stocks, and a rate hike is not automatically bearish.
Investors should also evaluate credit growth, deposit growth, asset quality, non-performing assets, and net interest margins when analyzing banking companies.
Understanding the Monetary Policy Transmission Mechanism
Illustrative educational model of how interest-rate decisions can influence the economy.
Policy rates → Bank funding costs and lending rates → Borrowing and spending → Business activity and inflation → Corporate earnings and financial markets.
The strength and timing of these effects depend on economic conditions and how financial institutions adjust their rates.
7. September 2026 Market Data: Key Observations
The market figures referenced in the original research draft provide a snapshot of the conditions investors were monitoring during September 2026.
| Indicator | Figure Referenced | Why It Matters |
|---|---|---|
| Nifty 50, September-end report | 22,620.45 | Indicates the reported monthly decline |
| Sensex, September-end report | 72,480.29 | Reflects broad large-cap market performance |
| Foreign investor outflows | Approximately $2.7 billion | Indicates selling pressure from foreign investors |
| Brent crude, late September | Above $100 per barrel | Raises concerns about import costs and inflation |
| India Flash Composite PMI | 56.5 | Indicates expansion in private-sector activity |
| RBI policy repo rate | 5.25% in the referenced data | Important monetary policy benchmark |
Data note: These figures are reproduced from the earlier research draft and should be independently verified against the original dated reports and official releases before publication. They should not be treated as live market quotes.
One important observation is that stock market performance and economic activity do not always move in the same direction.
Economic indicators can show expansion while equity prices decline because stock prices also reflect valuations, expected future earnings, interest rates, liquidity,y and global investor sentiment.
8. Three Possible Scenarios for the Indian Stock Market
Rather than relying on a single prediction, investors can evaluate multiple scenarios based on changes in market conditions.
Scenario 1: Potential Recovery
A recovery scenario may become more plausible if crude oil prices stabilize, geopolitical uncertainty decreases, foreign investor selling moderates, es and the Nifty 50 establishes a stronger price structure.
Possible observations include:
- Sustained buying in banking stocks.
- Improving market breadth.
- Higher lows in major indices.
- Reduced volatility expectations.
- Improving earnings outlooks.
These conditions would provide evidence to evaluate, not a guarantee of further gains.
Scenario 2: Sideways Market
A range-bound market may develop if crude oil remains elevated, institutional flows are mixed,xed and investors wait for clearer economic or corporate developments.
Possible characteristics include:
- Nifty trading between established support and resistance.
- Sector rotation.
- Failed breakouts.
- Short-term volatility.
- Mixed performance across large-cap and small-cap stocks.
In such conditions, traders should account for false breakouts and sudden reversals.
Scenario 3: Continued Market Weakness
Downside risks could remain if geopolitical tensions escalate, crude oil prices stay elevated, foreign investor selling continues, and major technical support levels fail.
Possible characteristics include:
- Weak market breadth.
- Selling across multiple sectors.
- Increased volatility.
- Pressure on the Indian rupee.
- Lower earnings expectations.
These are conditional scenarios, not predictions about which outcome will occur.
9. Risk Management for Traders and Investors
Market volatility can create both opportunities and risks. A disciplined risk-management process can help reduce the impact of unfavorable market movements.
For Swing Traders
- Evaluate daily and weekly trends before entering a trade.
- Define a stop-loss level before placing an order.
- Adjust position size according to risk.
- Avoid averaging down without reassessing the investment thesis.
- Consider earnings announcements and major macroeconomic events.
For Intraday Traders
- Do not interpret every opening gap as a trend reversal.
- Combine price action with volume and VWAP.
- Reduce exposure when market volatility increases.
- Account for transaction costs and liquidity.
- For options, monitor time decay, implied volatility, and bid-ask spreads.
For Long-Term Investors
- Evaluate earnings growth, debt levels and cash flow.
- Review portfolio concentration across sectors.
- Match investments to financial goals and time horizons.
- Distinguish short-term volatility from changes in business fundamentals.
- Review the original investment thesis when material information changes.
No trading strategy can eliminate market risk, and past performance does not guarantee future returns.
10. Daily Market Analysis Checklist
Investors can use the following checklist before the market opens and after the closing session.
| Indicator | What to Monitor |
|---|---|
| Nifty 50 | Trend, support and resistance |
| Bank Nifty | Relative strength of banking stocks |
| India VIX | Volatility expectations |
| Brent crude | Oil price direction |
| USD/INR | Currency movement |
| FII/DII data | Institutional flows |
| Advance-decline ratio | Market participation |
| RBI announcements | Rates and liquidity |
| Corporate earnings | Changes in company outlooks |
| Global markets | International risk sentiment |
Comparing several trading sessions can help investors distinguish temporary market noise from more persistent changes in market conditions.
Conclusion: Is a Stock Market Recovery Coming?
The Indian stock market is influenced by a combination of domestic economic conditions, global liquidity, institutional flows, crude oil prices, geopolitical developments, and corporate earnings.
Banking stocks may show relative strength even when the broader market remains weak. Similarly, a positive economic indicator does not necessarily lead to an immediate stock market recovery.
Investors evaluating the market outlook should monitor the Nifty 50 price structure, Bank Nifty performance, market breadth, FII/DII flows, India VIX, crude oil prices and earnings expectations.
The key takeaway: A single positive trading session or a rise in banking stocks does not confirm a sustainable market recovery. Multiple indicators and changing economic conditions need to be evaluated together.
Frequently Asked Questions (FAQs)
1. Is the Indian stock market recovering in 2026?
A recovery assessment requires current index data, market breadth, institutional flows,s and price-structure analysis. One positive trading session is not enough to establish a sustained recovery.
2. Why can Bank Nifty rise while Nifty 50 falls?
Bank Nifty tracks banking stocks, while Nifty 50 includes companies across several sectors. Weakness in IT, consumer, energy,gy or other sectors can outweigh gains in banking stocks.
3. How do crude oil prices affect the Indian stock market?
Sustained higher crude oil prices can increase import costs, influence inflation and put pressure on companies with high fuel or petroleum-linked expenses.
4. What are Smart Money signals?
Investors often use institutional flows, bulk deals, delivery activity, sector rotation and price-volume analysis to study large market participants. None of these indicators guarantees a particular market direction.
5. How does RBI policy affect banking stocks?
RBI policy decisions influence liquidity, borrowing costs, deposit rates and credit demand. The effect on each bank depends on its balance sheet and the speed at which its loan and deposit rates adjust.
6. Which indicators should investors monitor during a market downturn?
Important indicators include Nifty 50, Bank Nifty, India VIX, market breadth, FII/DII flows, Brent crude, USD/INR, and corporate earnings.
Disclaimer
This article is for educational and informational purposes only. It is not investment advice, a buy-or-sell recommendation, or a prediction of guaranteed market performance. Investing and trading in stocks and derivatives involve financial risk. Readers should independently verify current market data and consider their financial circumstances and risk tolerance before making investment decisions.
Top 10 SEO titles
- Stock Market Recovery 2026: Is Nifty Ready to Bounce Back?
- Banks Up, Market Down: What Happens Next in the Indian Stock Market?
- Nifty 50 & Bank Nifty Analysis: Recovery Signals to Watch in 2026
- Indian Stock Market Outlook 2026: Iran-US Tensions, Crude Oil & RBI
- Stock Market Crash or Recovery? Smart Money Signals Explained
- Crude Oil Above $100: Impact on Nifty 50 and Indian Stocks
- RBI Monetary Policy 2026: Impact on Bank Nifty and Banking Stocks
- FII vs DII Data: How to Track Smart Money in the Indian Stock Market
- Why Are Banking Stocks Rising While the Stock Market Is Falling?
- Nifty 50 Market Analysis: Key Recovery Signals and Downside Risks