

Introduction: Where Is the Nifty Market Bottom?
The Indian stock market is experiencing elevated volatility as investors respond to geopolitical uncertainty, rising crude oil prices, foreign investor outflows, and shifting global interest-rate expectations.
On September 29, 2026, the Nifty 50 closed at 22,716.20, down 64.05 points, or approximately 0.28%. The Sensex ended at 72,529.07, down 242.65 points. The Nifty briefly recovered from its intraday lows, but the broader market remained under pressure. Brent crude futures also remained elevated, while the US 10-year Treasury yield traded above 5.2%. These developments contributed to concerns about inflation, currency stability and corporate profitability.
The important question for investors is no longer simply why the market is falling. It is whether the correction is approaching a sustainable bottom or whether further downside remains possible.
There is no single indicator that can accurately identify a market bottom in advance. Instead, investors need to examine valuations, corporate earnings, crude oil prices, central bank policy, institutional positioning, and technical price levels together.
Here are six important takeaways that can help investors understand the current market environment.
1. Nifty Valuations and Corporate Earnings Are Coming Under Pressure
One of the most important factors during a prolonged market correction is the relationship between stock valuations and corporate earnings.
During periods of strong market sentiment, investors may be willing to pay premium valuations for expected future growth. However, when earnings disappoint, or macroeconomic risks increase, investors often become less willing to pay those premiums.
This process is known as valuation multiple contraction.
Why valuation compression matters
Suppose a company earns ₹100 per share and trades at a price-to-earnings ratio of 25. Its share price would be ₹2,500.
If the market later values the same earnings at a P/E ratio of 20, the implied share price would fall to ₹2,000, even if earnings remain unchanged.
This example illustrates how falling valuations can reduce share prices independently of an immediate decline in reported profits.
What investors should examine
- Quarterly revenue and profit growth.
- Operating margins and free cash flow.
- Management guidance and earnings revisions.
- Debt levels and interest coverage.
- Valuations relative to historical averages and industry peers.
A lower market P/E does not automatically mean stocks are cheap. Valuation should be assessed alongside earnings quality, future growth expectations and financial risk.
Investor takeaway: During a correction, focus on the relationship between price, earnings and business quality rather than buying a stock simply because its price has declined.
2. Crude Oil and Middle East Geopolitical Risks Could Influence the Next Market Move
Energy prices are an important variable for India because the country imports a substantial proportion of the crude oil it consumes.
On September 29, Brent crude futures declined during the session to approximately $103.32 per barrel, although prices remained elevated compared with earlier periods. Market participants continued to monitor Middle East supply disruptions, diplomatic developments and shipping conditions.
Higher crude oil prices can affect the Indian economy through several channels.
How expensive oil affects Indian markets
Import bill: Higher oil prices increase the cost of energy imports and can place pressure on the trade balance.
Rupee: A larger import bill can increase demand for foreign currency, potentially putting pressure on the Indian rupee.
Inflation: Higher fuel and transportation costs can feed into consumer prices and business expenses.
Corporate earnings: Aviation, paints, chemicals, logistics and other energy-intensive businesses may face margin pressure.
Foreign investment: Greater macroeconomic uncertainty can influence international investors’ willingness to maintain exposure to Indian equities.
The rupee closed near ₹95.98 per US dollar on September 29, after touching a weaker level earlier in the session. Currency movements and crude oil prices therefore remain important variables to monitor.
Three possible crude oil scenarios
| Scenario | Potential implications for India |
|---|---|
| Crude declines sustainably | Lower import-cost pressure and potential relief for inflation and corporate margins |
| Crude remains elevated | Continued uncertainty around inflation, the rupee and company profitability |
| Crude rises sharply | Greater pressure on energy-intensive sectors and imported inflation |
These are conditional scenarios, not price forecasts. A temporary decline in crude oil does not necessarily mean geopolitical risks have disappeared.
Investor takeaway: Watch the direction and persistence of crude oil prices rather than reacting to every intraday movement.
3. RBI Policy: Inflation, Currency Stability and Economic Growth
The Reserve Bank of India faces a policy challenge when inflationary pressures rise while financial markets are already under stress.
India’s retail inflation increased to 4.82% in August 2026, compared with 4.45% in July, according to the Ministry of Statistics and Programme Implementation. The RBI kept the policy repo rate unchanged at 5.25% at its August 2026 policy meeting.
More recent inflation pressures and currency weakness have increased attention on the RBI’s next policy decision. A Reuters report published on September 28 said that a majority of economists surveyed expected a possible rate increase at the October policy meeting.
However, an anticipated increase is not a confirmed decision, and the final policy outcome may differ from market expectations.
Three policy scenarios to monitor
| Scenario | Potential market transmission |
|---|---|
| Repo rate remains unchanged | May provide near-term relief to rate-sensitive sectors, depending on the policy statement and inflation outlook |
| 25-basis-point increase | Could raise borrowing costs modestly while signalling a response to inflation pressures |
| 50-basis-point increase | Could intensify short-term volatility in rate-sensitive stocks and borrowing-dependent businesses |
The actual market impact would depend on whether the decision is already reflected in asset prices, as well as the RBI’s guidance about future policy.
Which sectors are sensitive to interest rates?
- Banks and non-banking financial companies.
- Housing finance and real estate.
- Automobile manufacturers and vehicle-financing businesses.
- Capital goods companies that depend on external borrowing.
- Highly leveraged businesses with substantial refinancing requirements.
Higher rates do not affect every company equally. Banks, for example, can experience different outcomes depending on deposit costs, lending yields, bond portfolios and asset quality.
Investor takeaway: Track the official RBI policy statement, inflation data, currency movements and bond yields instead of treating a forecast rate hike as a certainty.
4. FII Positioning, India VIX and Derivatives Can Reveal Market Stress
Price movements alone do not fully explain the behaviour of market participants. Institutional cash-market flows, derivatives positioning and volatility indicators provide additional information.
On September 28, foreign institutional investors sold approximately ₹5,353 crore of Indian equities, while domestic institutional investors purchased approximately ₹5,189 crore. The domestic buying partially offset foreign selling, but it did not prevent the benchmark indices from declining sharply.
What these flows indicate
Foreign investors may reduce exposure when global yields rise, the rupee weakens, or geopolitical risks increase. Domestic institutional investors can provide support through purchases, although the balance between the two groups changes from session to session.
Daily flows should not be interpreted in isolation. Investors should examine multi-day and monthly trends alongside market prices.
Understanding India VIX
India VIX measures the market’s expectation of near-term volatility, derived from Nifty options prices.
A rising VIX can indicate greater uncertainty and a higher expected range of market movements. It does not, by itself, identify whether the next move will be upward or downward.
Investors can use the VIX to understand changing risk conditions, but it should not be treated as a direct prediction of the market bottom.
What derivatives traders should monitor?r
- Changes in futures open interest.
- Put and call open interest across relevant strikes.
- Implied volatility and changes in option premiums.
- Short covering versus fresh short positions.
- Price movement alongside trading volume.
- Expiry-related effects on derivatives positioning.
A reported increase in short positions does not automatically guarantee further market declines. Short covering can contribute to sharp recoveries when prices move against bearish positions.
Investor takeaway: Combine price action, cash-market flows, derivatives data and volatility measures. Avoid treating any single indicator as a reliable bottom signal.
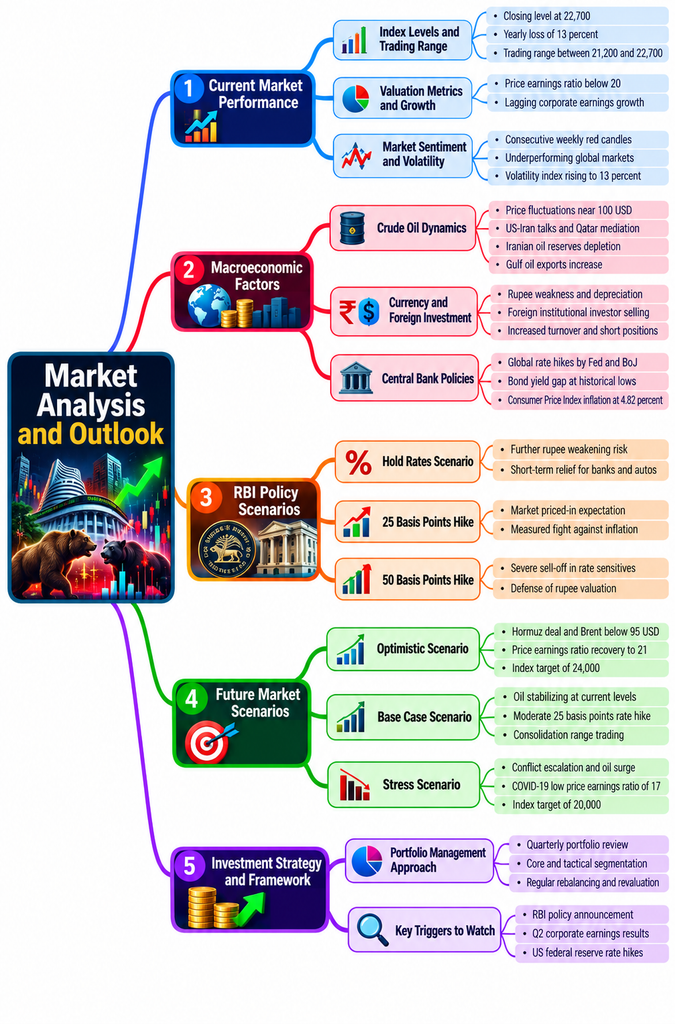
5. Nifty Support, Resistance and Market-Bottom Scenarios
Technical analysis can help investors define areas where buying or selling pressure may emerge. However, support and resistance are zones rather than guaranteed turning points.
Following the recent correction, the Nifty’s movement around 22,700, 22,850 and 23,000 has become particularly relevant to short-term market participants.
Market commentary published on September 28 identified 22,700 as a level to watch for potential additional weakness, with 22,500 as a possible next downside reference. It also discussed the possibility of a rebound toward 22,800–22,900 if buying interest improved.
These levels are reference points for scenario planning, not confirmed support or resistance based on a complete independent chart study.
Important technical zones
| Nifty level | Potential interpretation |
|---|---|
| 23,000–23,200 | Recovery zone to monitor if the index moves above near-term resistance |
| 22,800–22,900 | Potential rebound or rejection area |
| Around 22,700 | Near-term downside reference |
| Around 22,500 | Possible next downside reference if selling continues |
| 21,200 | Lower stress-testing level from the supplied scenario framework |
| 20,000 | Severe downside scenario from the supplied draft, not an established target |
The lower levels are included to illustrate risk planning, not because available data confirms that Nifty will fall to them.
Three market scenarios
Optimistic scenario: Crude oil prices moderate, geopolitical tensions ease, foreign selling slows and corporate earnings expectations stabilise. Under these conditions, a recovery could develop, although the strength of the recovery would depend on actual buying demand and valuation conditions.
Base scenario: Energy prices remain elevated, investors wait for clearer central-bank guidance and earnings growth remains mixed. In this environment, the market could continue to experience volatile, range-bound trading.
Stress scenario: Geopolitical risks intensify, oil prices rise further, the rupee weakens, ns and earnings expectations deteriorate. This combination could create additional downside pressure.
The 21,200–22,700 range and the 20,000 stress level mentioned in the original draft should be viewed as illustrative scenarios, not statistically established probabilities or precise market-bottom estimates.
What would strengthen the case for a bottom?
Investors could look for a combination of the following:
- Nifty stops making lower lows.
- The index reclaims resistance levels and sustains those gains.
- Market breadth improves across large-, mid- and small-cap stocks.
- Crude oil prices stabilise or decline.
- Foreign selling moderates.
- Corporate earnings revisions stop deteriorating.
- Volatility begins to ease without a fresh breakdown in prices.
No single condition guarantees a lasting recovery, but several improving indicators together can provide stronger evidence than one isolated green candle.
6. Is Buy and Hold Dead? A More Disciplined Portfolio Strategy
Market corrections often challenge investors who purchased stocks during periods of strong optimism. However, the claim that buy-and-hold investing is permanently broken is too broad.
Long-term investing can remain appropriate for investors who own financially sound businesses at reasonable valuations and have a suitable time horizon. At the same time, a passive approach does not eliminate company-specific risks, valuation risks, or the possibility of permanent capital loss.
A disciplined portfolio review can help investors distinguish temporary volatility from deterioration in the underlying business.
A practical portfolio review framework
1. Separate core investments from tactical positions. Long-term investments and short-term trading positions should have different objectives, review criteria and risk limits.
2. Review earnings and balance sheets. Examine debt, operating cash flow, profit margins, competitive advantages and management guidance.
3. Reassess concentration risk. A portfolio concentrated in banking, technology or other cyclical sectors may be particularly sensitive to a single macroeconomic shock.
4. Maintain liquidity. Avoid committing all available capital simply because prices have declined. Cash reserves can provide flexibility if new opportunities arise.
5. Use predefined position sizes. Decide how much capital can be exposed to an individual stock, sector or trade before entering a position.
6. Avoid indiscriminate averaging down. Additional purchases should depend on valuation, business quality and the original investment thesis, not just a lower market price.
7. Review the portfolio periodically. Quarterly reviews can help investors evaluate changes in earnings, debt, valuations and industry conditions without reacting emotionally to every daily market movement.
For short-term traders, stop-loss rules, position sizing and clear exit criteria remain important. Derivatives and leveraged trades require additional caution because losses can accumulate quickly.
Investor takeaway: A market bottom is difficult to identify in real time. A repeatable investment process is more useful than attempting to predict the exact lowest point.
What Investors Should Monitor in October 2026
The coming weeks may bring further information about inflation, central-bank policy, energy supply conditions and corporate earnings.
| Indicator | Why it matters |
|---|---|
| Brent crude oil | Signals potential changes in energy import costs |
| USD/INR | Helps monitor currency and imported-inflation pressure |
| RBI policy announcement | Clarifies the domestic interest-rate outlook |
| India CPI inflation | Indicates the persistence and breadth of price pressures |
| FII and DII flows | Helps assess institutional demand for equities |
| India VIX | Provides a measure of expected near-term volatility |
| Corporate earnings | Tests whether valuations are supported by business performance |
| Nifty market breadth | Shows whether participation in a recovery is broadening |
These indicators should be evaluated together. For example, falling crude oil prices may support market sentiment, but a recovery could remain limited if earnings expectations weaken or institutional selling continues.
Conclusion: Where Is the Nifty Market Bottom?
The September 2026 correction reflects a combination of geopolitical uncertainty, expensive energy, currency pressure, foreign investor selling, and changing interest-rate expectations. These factors can influence both corporate earnings and the valuation multiples investors are willing to pay.
However, the available evidence does not establish an exact market bottom. The 22,500, 21,200 and 20,000 levels represent different technical reference points or stress scenarios, not guaranteed destinations. Similarly, a recovery above 23,000 would need confirmation from sustained price action, market breadth and improving macroeconomic conditions.
Investors can prepare for several outcomes by monitoring crude oil, the rupee, inflation, institutional flows, technical levels and company fundamentals. Maintaining liquidity, controlling position sizes and reviewing business quality can help manage risk during periods of heightened uncertainty.
The central lesson is simple: do not confuse a temporary rebound with a confirmed recovery, and do not assume that every market decline creates an attractive investment opportunity.
The market bottom becomes clearer only with evidence. Until then, disciplined risk management and a scenario-based approach remain essential.
Frequently Asked Questions (FAQs)
1. Where is the Nifty market bottom in 2026?
The exact bottom cannot be known in advance. Traders are monitoring the 22,700 and 22,500 areas as near-term downside references, while lower levels such as 21,200 and 20,000 belong to more severe stress scenarios. These are not guaranteed targets.
2. Why is the Indian stock market falling in September 2026?
Recent weakness has coincided with elevated crude oil prices, geopolitical uncertainty, foreign investor selling, higher US Treasury yields and concerns about inflation and corporate margins.
3. What happens if crude oil prices remain above $100 per barrel?
Sustained high prices can increase India’s import bill and put pressure on the rupee, inflation and fuel-intensive businesses. The actual effect depends on the duration of the price increase and how businesses and policymakers respond.
4. Will the RBI increase interest rates in October 2026?
A rate increase has been discussed by economists amid rising inflation pressures, but the final decision remains subject to the RBI’s assessment of incoming economic data and financial conditions.
5. Does a rising India VIX mean Nifty will fall further?
No. A higher India VIX signals greater expected volatility, not a guaranteed direction. The index can rise or fall sharply during periods of elevated volatility.
6. Should investors buy stocks during a market correction?
The decision depends on valuations, business fundamentals, financial circumstances,s and risk tolerance. A falling price alone does not establish that a stock is undervalued.
7. Is buy-and-hold investing still relevant?
It can remain appropriate for suitable long-term investors, but it requires attention to valuation, business quality, concentration and changes in the investment thesis. No strategy eliminates investment risk.
Disclaimer
This article is for educational and informational purposes only and does not constitute financial or investment advice. Market data, technical levels, policy expectations and possible scenarios are subject to change. No market level or scenario discussed here guarantees future performance. Readers should independently verify the information, conduct their own research, and consult a qualified financial advisor before making investment decisions. Investments in securities and derivatives are subject to market risks, including possible loss of capital.