
War in the Gulf and the Nifty Crash: 5 Hidden Market Signals Investors Must Understand Before the Next Sell-Off
War in the Gulf and the Nifty Crash: 5 Hidden Market Signals Investors Must Understand Before the Next Sell-Off
Global markets rarely react to headlines alone. Behind every sharp move lies a combination of geopolitical risk, institutional positioning, liquidity shifts, and technical market structure. Whenever tensions rise in the Gulf region, investors immediately begin reassessing inflation, oil prices, currency stability, and global economic growth.
For Indian investors, these developments deserve close attention because India imports a significant portion of its crude oil requirements. A sustained increase in oil prices can affect inflation, corporate earnings, government finances, and investor sentiment.
In recent sessions, many traders have focused on Foreign Institutional Investor (FII) cash-market buying. However, experienced market participants know that cash flows tell only part of the story. Futures positioning, options data, volatility indicators, and technical momentum often provide additional context.
This article explores five important market signals that investors should monitor during periods of heightened geopolitical uncertainty.
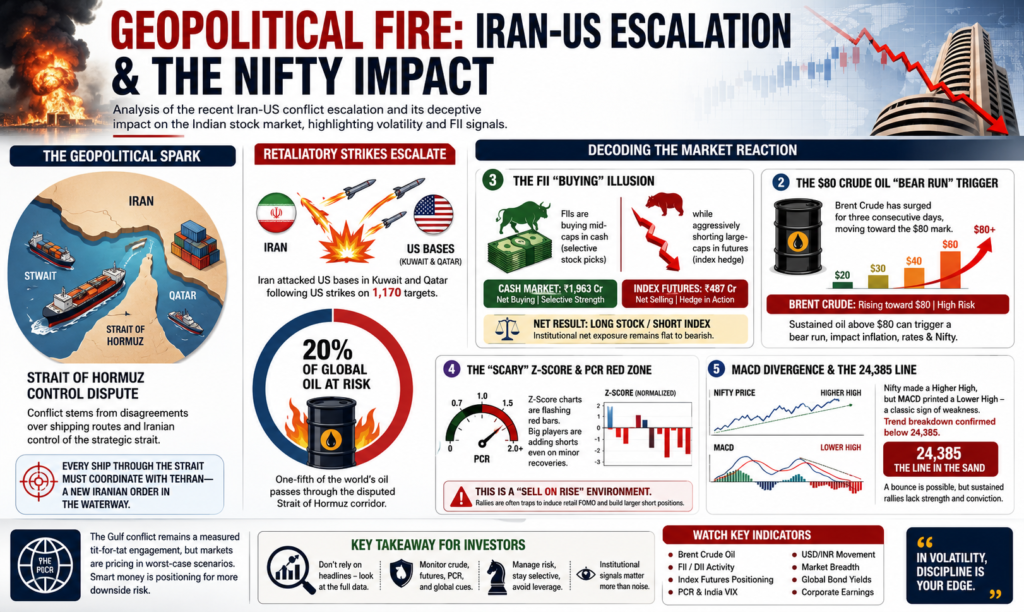
1. Gulf Tensions and the Strategic Importance of the Strait of Hormuz
The Strait of Hormuz is one of the world’s most important energy chokepoints. A large share of global crude oil exports passes through this narrow shipping route.
Whenever geopolitical tensions increase around the Gulf, markets immediately begin pricing in the possibility of:
- Higher transportation costs
- Increased shipping insurance premiums
- Temporary supply disruptions
- Higher crude oil prices
- Increased global inflation expectations
Even if no actual blockade occurs, uncertainty alone is often enough to push commodity prices higher because traders price in future risk.
For India, which remains one of the world’s largest oil importers, rising crude prices generally increase macroeconomic pressure through:
- Higher import bills
- Rupee depreciation risks
- Rising inflation
- Pressure on fiscal balances
- Lower corporate margins in fuel-intensive industries
Markets, therefore,e closely monitor every development in the Gulf region.
2. Why the $80 Brent Crude Level Matters
Crude oil acts as a leading macroeconomic indicator.
When Brent crude remains comfortably below major resistance levels, equity markets usually focus on earnings growth and economic expansion.
However, sustained prices above approximately $80 per barrel may begin affecting market sentiment because higher energy costs can feed into:
- Transportation expenses
- Manufacturing costs
- Aviation
- Chemicals
- Fertilizers
- Consumer inflation
Higher inflation also increases uncertainty regarding future monetary policy.
Although every market cycle is different, investors typically become more cautious when oil prices remain elevated for an extended period.
The sectors that generally experience the greatest pressure include:
- Airlines
- Paint companies
- Logistics
- Chemicals
- Auto manufacturers
- Consumer discretionary businesses
Meanwhile, upstream energy producers and certain oil-related companies may benefit from stronger crude prices.
3. Understanding the FII Cash Buying vs Futures Positioning Puzzle
Many retail investors focus only on daily FII cash-market figures.
However, institutional positioning is considerably more complex.
An institution may simultaneously:
- Buy high-quality stocks in the cash market.
- Hedge overall market exposure using index futures.
- Rotate capital between sectors.
- Reduce portfolio volatility.
This means positive cash-market inflows do not automatically indicate bullish market expectations.
Professional investors typically analyze:
- Cash Market Buying
- Index Futures Positioning
- Stock Futures Activity
- Options Open Interest
- Currency Movement
- Bond Yields
- Volatility
For example, an institution purchasing banking stocks while maintaining short index futures may simply be reducing sector-specific risk rather than expressing confidence in the broader market.
This is why experienced traders examine net exposure instead of relying solely on cash-market headlines.
4. PCR, Volatility, and Market Positioning
The Put-Call Ratio (PCR) is one of the most widely followed options indicators.
It helps traders estimate market positioning by comparing put option activity with call option activity.
However, PCR should never be used in isolation.
Professional traders combine it with:
- India VIX
- Open Interest changes
- Price action
- Volume
- Market breadth
- Futures data
During periods of elevated uncertainty, short-covering rallies can occur quickly.
These rallies may appear strong, but can reverse just as rapidly if fresh selling emerges.
Instead of assuming every bounce signals the beginning of a new bull trend, traders often wait for confirmation through:
- Higher highs
- Higher lows
- Increasing market breadth
- Rising delivery volumes
- Strong institutional participation
Patience often proves more valuable than reacting to every intraday move.
5. MACD Divergence and Trend Confirmation
Momentum indicators help investors evaluate whether price trends are strengthening or weakening.
One widely used indicator is the Moving Average Convergence Divergence (MACD).
A bearish divergence occurs when:
- Price records a higher high.
- MACD records a lower high.
This suggests that upward momentum is weakening even though prices continue rising.
It does not guarantee a market decline, but it serves as a warning that buying momentum may be fading.
Professional traders usually combine MACD divergence with:
- Trendline breaks
- Volume confirmation
- Moving averages
- Support levels
- Market breadth
No single indicator should be treated as a complete trading system.
Instead, divergence works best as part of a broader analytical framework.
What Investors Should Watch Next
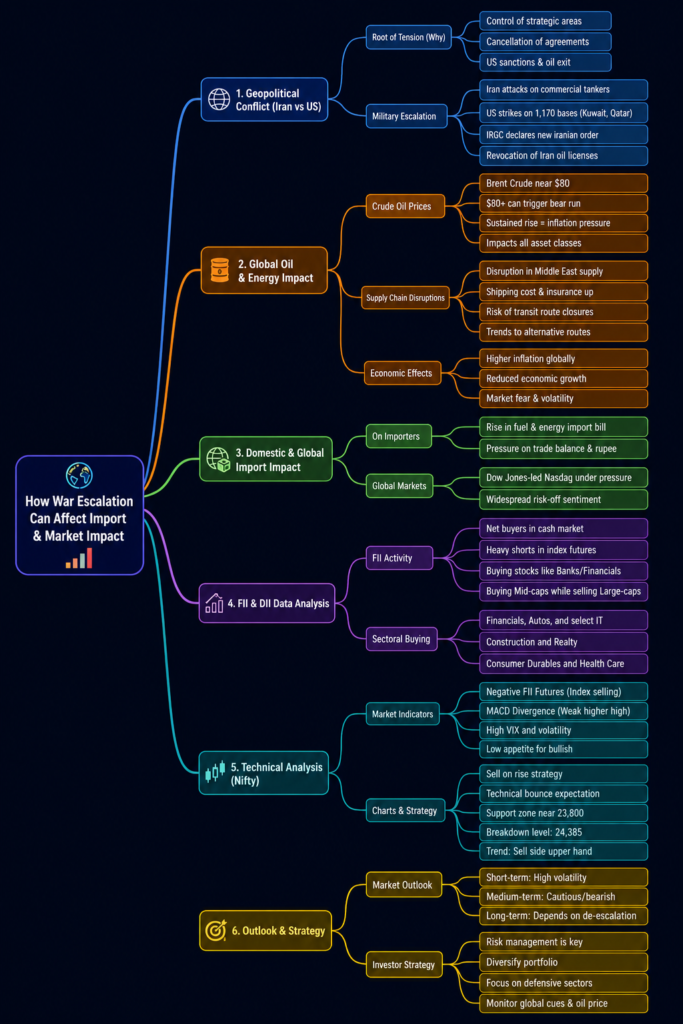
Rather than reacting emotionally to daily headlines, investors may find it more useful to monitor a combination of macroeconomic and market indicators.
Key factors include:
- Brent Crude Oil
- India VIX
- USD/INR exchange rate
- FII and DII activity
- Index futures positioning
- Put-Call Ratio
- Market breadth
- Corporate earnings
- Central bank commentary
- Global bond yields
Together, these indicators provide a more comprehensive picture of market risk than any single data point.
Risk Management During Geopolitical Uncertainty
Periods of geopolitical stress often lead to increased volatility.
Some practical risk-management principles include:
- Avoid excessive leverage.
- Diversify across sectors.
- Maintain appropriate stop-loss levels.
- Avoid making decisions solely on news headlines.
- Monitor position sizing carefully.
- Review portfolio exposure to oil-sensitive industries.
- Keep sufficient cash available for opportunities created by volatility.
Successful investing often depends more on disciplined risk management than on predicting every market move.
Final Thoughts
Geopolitical developments can influence markets through oil prices, inflation expectations, currency movements, and investor sentiment. However, markets are driven by many interacting factors, including economic data, corporate earnings, central bank policy, and institutional positioning.
Rather than relying on isolated indicators such as FII cash buying or a single technical signal, investors benefit from analyzing multiple data points together.
Periods of uncertainty often create both risks and opportunities. Investors who remain disciplined, focus on data instead of emotions, and maintain a long-term perspective are generally better positioned to navigate volatile market conditions.
As always, no single indicator can predict market direction with certainty. Building an investment process based on evidence, diversification, and sound risk management remains the most reliable approach.
FAQs
Does war in the Gulf always cause the Nifty to fall?
No. While geopolitical tensions can increase volatility and influence oil prices, the Nifty is also affected by domestic economic growth, corporate earnings, monetary policy, and global investor sentiment.
Why is crude oil important for Indian markets?
India imports a large portion of its crude oil. Higher oil prices can increase inflation, widen the trade deficit, and pressure corporate margins in several sectors.
Are FII cash-market inflows always bullish?
Not necessarily. FIIs may buy stocks while simultaneously hedging or reducing overall market risk through index futures or options.
Is MACD divergence a sell signal?
MACD divergence is a warning that momentum may be weakening. It should be used alongside other technical and fundamental indicators rather than as a standalone trading signal.
What should investors monitor during periods of geopolitical uncertainty?
Investors should watch Brent crude prices, India VIX, FII and DII flows, futures positioning, USD/INR, inflation trends, corporate earnings, and central bank policy announcements.
Disclaimer: This article is intended solely for educational and informational purposes and should not be construed as investment advice or a recommendation to buy or sell any security. Financial markets involve risk, and investors should conduct their own research or consult a qualified financial advisor before making investment decisions.
- War in the Gulf: 5 Hidden Reasons Why Nifty Could Face a Bigger Crash
- Gulf War Impact on Nifty: 5 Market Signals Smart Investors Can’t Ignore
- Nifty Crash Ahead? How Gulf Tensions, Crude Oil & FIIs Are Reshaping the Market
- The Gulf War Shock: 5 Powerful Signals That Could Decide Nifty’s Next Move
- Nifty Under Pressure: The Real Market Story Behind the Gulf War and Rising Oil
- War, Oil & FIIs: The Hidden Forces Driving Nifty’s Next Big Move
- The Red Sea Effect: How Gulf Tensions Could Trigger the Next Nifty Correction
- Beyond the Headlines: 5 Hidden Market Signals Every Nifty Investor Must Watch
- Gulf Conflict vs Nifty: What Smart Money Knows That Retail Investors Don’t
- Nifty at a Crossroads: Gulf War, $80 Oil, FIIs & the Battle for Market Direction