
Indian stock markets are facing one of the most challenging phases of 2026. While many retail investors celebrated the second-half recovery, market data suggests that the rally may be nothing more than a temporary bounce in a larger downtrend.
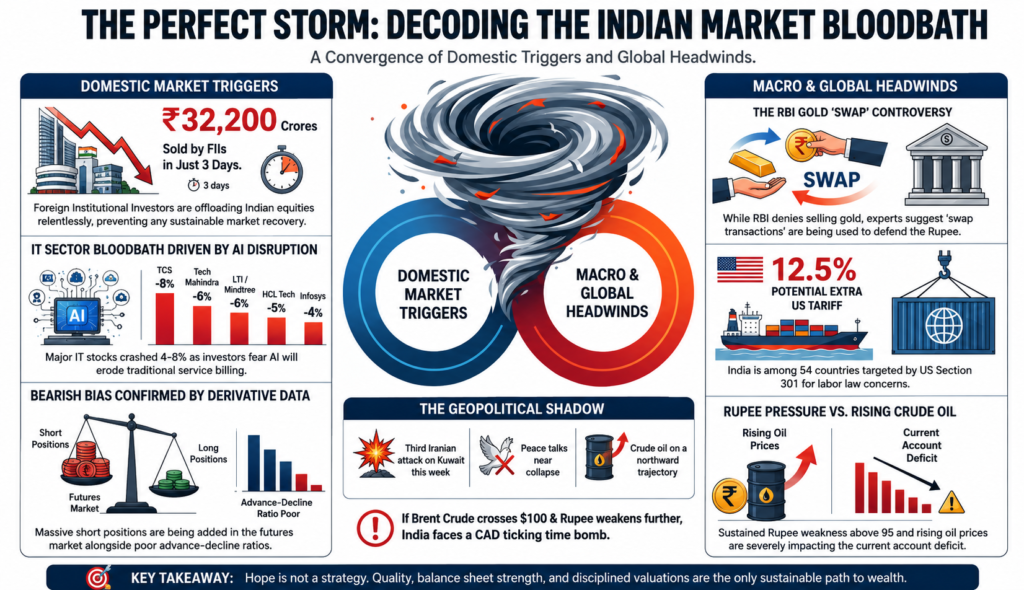
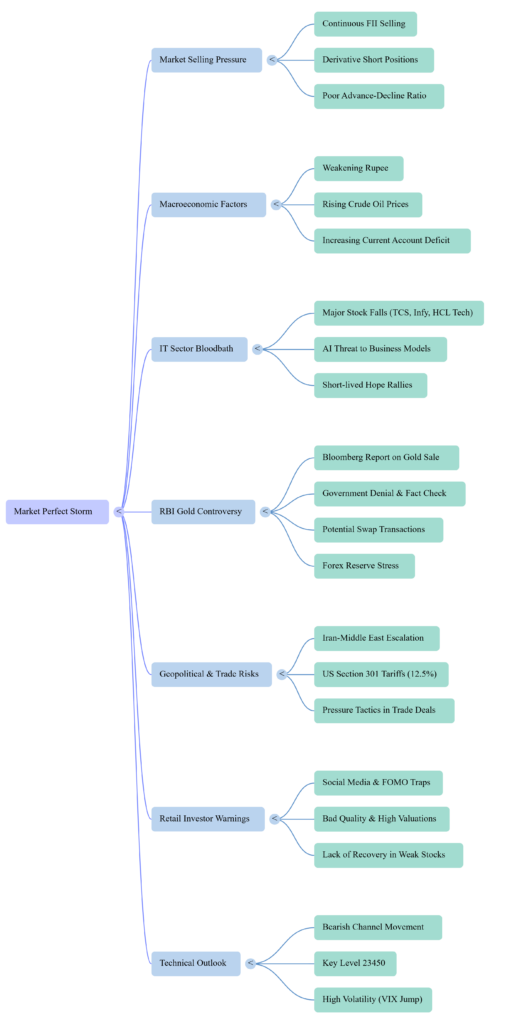
A combination of FII selling, Rupee weakness, rising crude oil prices, geopolitical tensions, and trade-related uncertainties is creating a perfect storm for Indian equities.
The key question investors must ask is simple:
Is this a genuine market recovery, or are we witnessing a classic bull trap?
RBI Gold Reserve Controversy: Sale or Strategic Swap?
A recent report claiming that the Reserve Bank of India moved nearly $12 billion worth of gold reserves created panic across financial markets.
Although officials denied any sale of gold and confirmed India’s gold reserves remain around 880 tonnes, experts believe the possibility of a gold swap transaction cannot be ignored.
What is a Gold Swap?
A gold swap allows a central bank to exchange gold for US dollar liquidity while still keeping the asset on its balance sheet.
Benefits include:
- Immediate access to foreign currency
- Support for the Rupee
- Improved forex liquidity
- Avoidance of direct reserve depletion headlines
However, if such measures are being considered, it signals that pressure on India’s foreign exchange reserves is becoming increasingly serious.
The IT Sector Crash: AI Creates a New Challenge
Indian IT stocks witnessed one of their worst sessions in recent years.
Major Losers
- TCS: -8%
- Tech Mahindra: -6%
- LTIMindtree: -6%
- HCL Technologies: -5%
- Infosys: -4%
The AI Paradox
Artificial Intelligence is increasing productivity at unprecedented levels.
However, India’s traditional IT business model depends heavily on billing clients based on employee hours.
As AI automates coding, testing, support, and analytics functions, fewer billable hours may be required.
This creates a serious challenge:
Higher efficiency may actually reduce revenue under the current billing structure.
Until Indian IT companies successfully transition toward AI products, platforms, and outcome-based pricing models, investors may continue to question future growth prospects.
Section 301 Tariff Threat: A New Trade War Risk?
The United States has reportedly identified India among countries facing scrutiny under Section 301 regarding labor practices.
The proposed additional 12.5% tariff threat comes at a sensitive time when trade negotiations are ongoing.
Why It Matters
A higher tariff could impact:
- Textile exports
- Engineering goods
- Pharmaceuticals
- Auto components
- Manufacturing exports
Many analysts view this as a negotiating tool rather than an immediate policy action.
Nevertheless, markets dislike uncertainty, and the possibility of additional tariffs has increased investor nervousness.
Foreign Investors Continue to Exit India
Foreign Institutional Investors (FIIs) have sold more than ₹32,000 crore worth of Indian equities within a few sessions.
Why Are FIIs Selling?
Global capital always moves toward the highest expected returns.
Currently, investors are attracted by:
- US AI companies
- Semiconductor stocks
- Advanced technology firms
- High-growth innovation sectors
While Indian investors focus on minor tax changes, global funds are chasing opportunities capable of delivering double-digit gains in short periods.
This divergence explains the ongoing FII outflow.
Retail Investors: Avoid the Hope Trap
One of the biggest mistakes retail investors make is confusing price decline with value.
History shows that not every fallen stock recovers.
Wealth Creators
- Bajaj Finance
- Titan
- Asian Paints
- HDFC Bank
Wealth Destroyers
- Unitech
- Suzlon (for long periods)
- Several speculative IPOs
Successful investing requires:
✔ Strong balance sheets
✔ Consistent earnings growth
✔ Competitive advantages
✔ Reasonable valuations
Hope alone cannot create shareholder wealth.
Rising Crude Oil Prices: India’s Biggest Macro Risk
Geopolitical tensions in the Middle East continue to push crude oil prices higher.
For an oil-importing nation like India, this creates significant economic risks.
If Brent Crude Crosses $100
Potential consequences include:
- Higher inflation
- Increased import bills
- Wider Current Account Deficit (CAD)
- Rupee depreciation
- Higher interest rate pressures
India imports nearly 85% of its crude oil requirements, making energy prices a critical factor for economic stability.
Rupee Weakness and the CAD Challenge
The Indian Rupee remains under pressure against the US Dollar.
A weaker currency creates several challenges:
- More expensive imports
- Increased inflation
- Higher corporate costs
- Pressure on foreign reserves
If oil prices continue rising while the Rupee weakens further, policymakers may face difficult decisions regarding intervention and economic growth priorities.
What Derivatives Data Is Signaling
Market positioning continues to reflect caution.
Key indicators include:
- Rising Open Interest in futures
- Falling Put-Call Ratio (PCR)
- Increased short positions
- Weak advance-decline ratio
These signals suggest traders remain defensive and are using rallies to reduce exposure rather than initiate aggressive buying.
Investment Strategy for 2026
Investors should focus on:
Sectors Likely to Remain Resilient
- Banking
- Capital Goods
- Defence
- Railways
- Renewable Energy
- Infrastructure
Areas Requiring Caution
- Highly leveraged companies
- Speculative small caps
- Loss-making startups
- Companies dependent on global outsourcing demand
Maintaining cash reserves and focusing on quality businesses remains the preferred strategy during periods of uncertainty.
Conclusion
The Indian market currently stands at a critical crossroads.
Multiple risks are emerging simultaneously:
- FII outflows
- Rupee weakness
- Rising crude oil prices
- Trade tensions
- Geopolitical instability
- Structural challenges in the IT sector
While short-term rallies may continue, investors should avoid confusing volatility with recovery.
The coming months will largely depend on three factors:
- RBI’s ability to stabilize the Rupee.
- Global crude oil prices.
- Foreign investor sentiment toward emerging markets.
If these pressures intensify, India could face a deeper market correction. However, for disciplined long-term investors, such periods often create opportunities to accumulate fundamentally strong companies at attractive valuations.
Remember: Wealth is created through quality, patience, and discipline—not through hope and speculation.
FII / DII Market Analysis
Sensibull data: Futures, Options, Cash Market — Smart Money ka full breakdown
gbullsnbears.com | 03 Jun 2026
Overall Sentiment — 3 Jun 2026
SELL
Index Fut: −29,157
Cash: −₹5,617 Cr
BUY
Index Fut: +3,553
Cash: +₹5,741 Cr
MIXED
Fut Bullish +16,044
Put OI 1.99L
BUY
Stock Fut: +66,719
Idx Opt: Strong Bull
FII — Segment-wise Breakdown
DII — Segment-wise Breakdown
Cash Market — FII vs DII (Recent Days)
Options OI — Who’s Positioning Where?
Call OI
−2.51L
Calls shedding
Put OI
+5.38L
Puts adding
Signal: FII put buying = downside hedge laga raha hai
Call OI
+1.63L
Calls adding
Put OI
−7.6L
Puts shedding
Signal: Retail call buy + put shed = bullish bet
Call OI
80,722
Heavy calls
Put OI
1.99L
Puts holding
Signal: Pros balanced/hedged position
Call OI
7,726
Minimal
Put OI
23,860
Portfolio hedge
Signal: DII buys cash, hedges via puts
Market Interpretation — Bulls&Bears Track
Bears (FII)
Futures short chal rahi
Cash market mein sell
Put OI badh raha hai
23,300–23,400 support test ho sakta
Bulls (DII + Client)
Cash market absorption strong
Har dip pe DII buyer
Client call OI add kar raha
23,500–24,000 range expected
Data Sheet — Market Track
Nifty, IV, PCR, VIX, Futures OI, FII Index Futures | May–Jun 2026
gbullsnbears.com
| Date | Nifty | Nifty Gain |
Call IV | Put IV | PCR | VIX | Future Cur Mo OI add |
Future Next Mo OI add |
Future Cur Mo Premium |
Future Next Mo Premium |
NSE Turnover |
Adv | Decline | FII Index Futures |
|---|---|---|---|---|---|---|---|---|---|---|---|---|---|---|
| 18 May 2026 | 23,649.95 | +6.45 | 17.67 | 20.84 | 1.23 | 19.63 | −7,108 | 4,224 | 9 | 81.35 | 1,23,179 | 941 | 2,382 | −2,09,866 |
| 19 May 2026 | 23,618.00 | −31.95 | 14.48 | 19.16 | 0.94 | 18.68 | 2,741 | 3,110 | −13 | 79.7 | 1,30,791 | 2,152 | 1,109 | −2,16,280 |
| 20 May 2026 | 23,659.00 | +41.0 | 16.66 | 16.48 | 1.18 | 18.44 | 1,080 | 6,756 | 36 | 117.8 | 1,14,241 | 1,722 | 1,543 | −2,22,520 |
| 21 May 2026 | 23,655.00 | −4.0 | — | — | 1.00 | 17.82 | 23,614 | 30,279 | −19.7 | 60.3 | 1,20,905 | 1,910 | 1,374 | −2,31,190 |
| 22 May 2026 | 23,719.50 | +64.5 | 10.67 | 12.64 | 1.07 | 17.82 | −1,287 | 45,729 | 57 | 122.7 | 1,12,950 | 1,748 | 1,522 | −2,24,992 |
| 25 May 2026 | 24,031.70 | +312.4 | 12.67 | 15.82 | 1.26 | 15.82 | 39,868 | 1,897 | 123 | 213.3 | 1,19,294 | 2,271 | 1,046 | −2,14,977 |
| 26 May 2026 | 23,913.70 | −118 | 11.4 | 16.58 | 0.97 | 16.13 | 46,074 | 1,808 | 84 | 173.3 | 1,27,132 | 1,655 | 1,652 | −1,52,865 |
| 27 May 2026 | 23,907.15 | −6.55 | 11.29 | 15.68 | 1.02 | 14.98 | 7,023 | 1,030 | 99 | 193.45 | 1,35,606 | 1,772 | 1,535 | −1,63,012 |
| 29 May 2026 | 23,547.75 | −359.4 | 15.84 | 15.09 | 0.74 | 16.18 | 60,249 | 2,314 | 192 | 292.25 | 2,86,872 | 1,145 | 2,171 | −2,01,309 |
| 1 Jun 2026 | 23,382.60 | −165.15 | 13.08 | 16.75 | 0.69 | 16.54 | 17,362 | 1,585 | 77 | 177.4 | 1,32,305 | 1,150 | 2,202 | −2,23,180 |
| 2 Jun 2026 | 23,483.55 | +100.95 | 13.34 | 16.25 | 1.05 | 15.36 | 646 | 1,569 | 121.45 | 224.45 | 1,43,327 | 2,034 | 1,285 | −2,30,096 |
| 3 Jun 2026 ★ | 23,405.60 | −77.95 | 13.46 | 16.42 | 1.02 | 16.28 | 28,770 | 1,508 | 84 | 186.4 | 1,35,058 | 1,379 | 1,915 | — |
Disclaimer: This analysis is for educational purposes only and should not be considered investment advice. Always do your own research before investing.