
Introduction: The Pharmaceutical Industry Is Entering a Major Inflection Point
The global pharmaceutical industry is approaching one of its most important structural events of the decade: the 2026–2030 patent cliff.
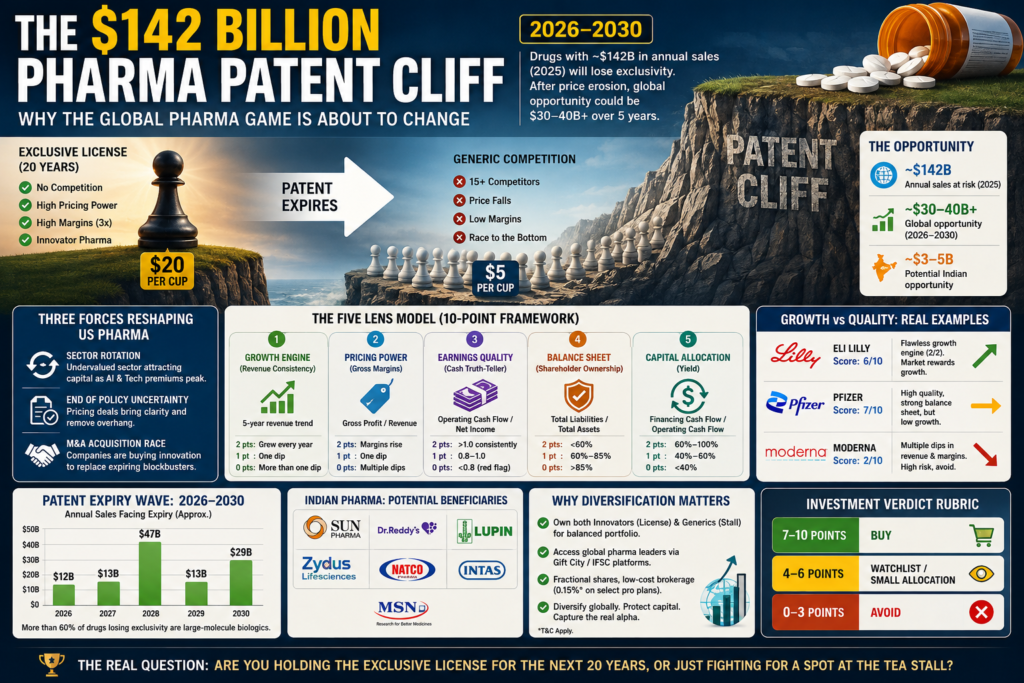
According to CareEdge Ratings, drugs generating approximately $142 billion in annual sales during 2025 are expected to lose exclusivity between 2026 and 2030. After accounting for the steep price erosion that normally follows generic and biosimilar entry, the resulting global market opportunity could exceed $30–40 billion over five years.
For Indian pharmaceutical companies, CareEdge estimates that the opportunity could translate into approximately $3–5 billion of potential revenue opportunity.
But there is an important distinction investors need to understand:
$142 billion is the annual sales base exposed to patent expiry—not $142 billion of new opportunity.
That distinction changes the entire investment thesis.
The patent cliff will simultaneously create:
- Revenue pressure for originator pharma companies
- New opportunities for generic manufacturers
- A major biosimilar opportunity
- More pharmaceutical M&A
- A potential re-rating of companies with strong replacement pipelines
For Indian investors, this creates an interesting question:
Should you own the companies losing exclusivity, or the companies waiting to enter the market after exclusivity disappears?
1. The $142 Billion Number: What Does It Really Mean?
The headline number is enormous.
Drugs with approximately $142 billion of annual 2025 sales are expected to lose exclusivity between 2026 and 2030.
However, investors should not assume that the entire $142 billion will immediately become available to generic companies.
When a blockbuster drug loses patent protection, the original manufacturer usually faces:
- Generic competition
- Biosimilar competition
- Price reductions
- Market-share erosion
- Reimbursement pressure
- Lower margins
At the same time, generic companies face:
- Regulatory approvals
- Manufacturing investment
- Litigation
- Competition from multiple manufacturers
- Pricing pressure
CareEdge estimates that after accounting for price erosion, the total opportunity could be more than $30–40 billion over five years, with Indian companies potentially capturing around $3–5 billion.
The simplified math
| Metric | Estimate |
|---|---|
| Sales exposed to patent expiry | ~$142B |
| Potential global opportunity after erosion | ~$30–40B+ |
| Potential Indian opportunity | ~$3–5B |
| Period | 2026–2030 |
| Large molecules | >60% of drugs losing exclusivity |
The last number is particularly important.
More than 60% of the drugs in this patent cycle are large-molecule biologics, making this cycle fundamentally different from previous generic waves.
2. The Tea Stall vs. The Exclusive License
Think of the pharmaceutical industry like a tea market.
Imagine the government gives you an exclusive 20-year licence to sell tea in the busiest location in the city.
Nobody else can legally sell the same product.
You can charge ₹200 for a cup.
Your margins are enormous.
That is the innovator pharma model.
Now imagine your patent expires.
Suddenly, 15 competitors enter the same street.
The price falls to ₹50.
Customers have alternatives.
Your market share falls.
This is the patent cliff.
Generic manufacturers are effectively the new tea stalls.
The innovator owns the intellectual property.
The generic company owns the manufacturing capability.
Both can make money—but the economics are very different.
3. Why 2026–2030 Could Be Different From Previous Patent Cycles
This patent cycle has an important characteristic:
Biologics are becoming increasingly important.
Small-molecule drugs can often be replicated relatively efficiently once patents expire.
Biologics are different.
They are complex molecules produced through biological systems. Developing a biosimilar can require:
- Significant R&D
- Complex manufacturing
- Clinical and analytical studies
- Regulatory expertise
- High capital investment
- Strong quality-control systems
Therefore, patent expiry does not automatically mean immediate competition.
This creates an important competitive advantage for companies that already have:
- Biosimilar capabilities
- Complex generics
- Injectables
- Specialty manufacturing
- USFDA-approved facilities
- Strong regulatory teams
This is one reason Indian companies such as Sun Pharma, Dr. Reddy’s Laboratories, Lupin, Zydus Lifesciences and other specialised manufacturers are being watched for the upcoming opportunity.
4. The Patent Cliff Is Already Creating Real-World Opportunities
A good example is semaglutide, the active ingredient associated with Ozempic and Wegovy.
After the relevant Indian patent protection ended in March 2026, multiple Indian pharmaceutical companies moved toward launching competing products.
Reuters reported that companies including Sun Pharma, Dr. Reddy’s Laboratories and Lupin were among the Indian players preparing products following the expiry.
This illustrates the economic mechanism:
Patent expiry → competition → lower prices → larger patient access → volume opportunity for manufacturers.
The same principle can play out across other high-value therapies.
5. The Five-Year Patent Cliff Timeline
CareEdge’s analysis provides an interesting year-by-year picture of the patent expiry wave.
Approximate annual sales exposed to expiry include:
| Year | Approx. Sales Facing Expiry |
|---|---|
| 2026 | ~$12B |
| 2027 | ~$13B |
| 2028 | ~$47B |
| 2029 | ~$13B |
| 2030 | ~$29B |
| Total | ~$114B in this breakdown |
The detailed CareEdge chart separates large and small molecules and its headline total is approximately $142 billion; investors should therefore treat the annual chart as a subset/detail of the broader dataset, not simply add figures without checking the methodology.
The key message
2028 stands out as an especially important year in the currently identified expiry schedule.
That means investors should not think of the patent cliff as one event occurring in 2026.
It is a multi-year earnings transition.
6. The Three Forces Reshaping Global Pharma
Force #1: Patent Expiries
The first force is obvious.
Blockbuster drugs eventually lose exclusivity.
When they do, revenue streams that previously enjoyed strong pricing power become vulnerable.
Pfizer’s own 2025 annual filing explicitly states that it expects a significant reduction in revenue from patent-based or regulatory exclusivity expiries during 2026–2030.
This makes pipeline replacement one of the most important metrics for large pharma.
7. Force #2: The M&A Race
The second force is acquisition.
Big Pharma companies cannot simply wait for their biggest products to decline.
They need replacement growth.
That means acquiring:
- Biotech companies
- Oncology assets
- Immunology drugs
- Obesity treatments
- Neurology assets
- Cardiovascular therapies
- Early-stage drug platforms
The M&A wave is already visible.
Reuters reported that biotech M&A reached approximately $84 billion in the first quarter of 2026, nearly double the comparable year-earlier level. Patent expirations were cited as an important driver of the urgency.
J.P. Morgan has also highlighted the potential for increased healthcare and biotech M&A activity, with the patent cliff being one factor behind dealmaking urgency.
The investment implication
The next pharma winner may not necessarily be the company with today’s biggest blockbuster.
It could be the company with the best pipeline and smartest capital allocation.
8. Force #3: Biologics and Biosimilars
This could become the biggest opportunity for Indian pharma.
More than 60% of the drugs losing exclusivity in this cycle are large-molecule biologics.
That creates a higher barrier to entry.
Unlike traditional generics, biosimilars require:
- Advanced manufacturing
- Scientific expertise
- Regulatory capabilities
- Large capital investment
- Long development timelines
Therefore, the competitive landscape may be less fragmented.
This is potentially good news for companies that already possess the required infrastructure.
9. Growth vs. Quality: The Investor’s Dilemma
One of the biggest mistakes investors make is looking at only one metric.
A pharma company can have:
Excellent margins + weak growth
or
Strong growth + weaker current quality
The market may value them very differently.
Consider Eli Lilly.
Its 2025 revenue reached approximately $65.2 billion, up 45% from 2024, while net income increased 95% to approximately $20.6 billion. Mounjaro generated about $23.0 billion and Zepbound about $13.5 billion in 2025.
This demonstrates why growth can overwhelm traditional valuation metrics.
A company with a powerful growth engine can receive a premium valuation even when its valuation looks expensive relative to slower-growing peers.
10. Pfizer Shows the Other Side
Pfizer generated approximately $62.6 billion of revenue in 2025, down 2% from 2024.
However, excluding COVID-related products, operational revenue growth was approximately 6%.
This demonstrates why investors should look beneath headline revenue.
The important question is:
What happens after the declining products disappear?
A pharma company must continuously replace lost revenue with new products.
That is the real long-term competitive test.
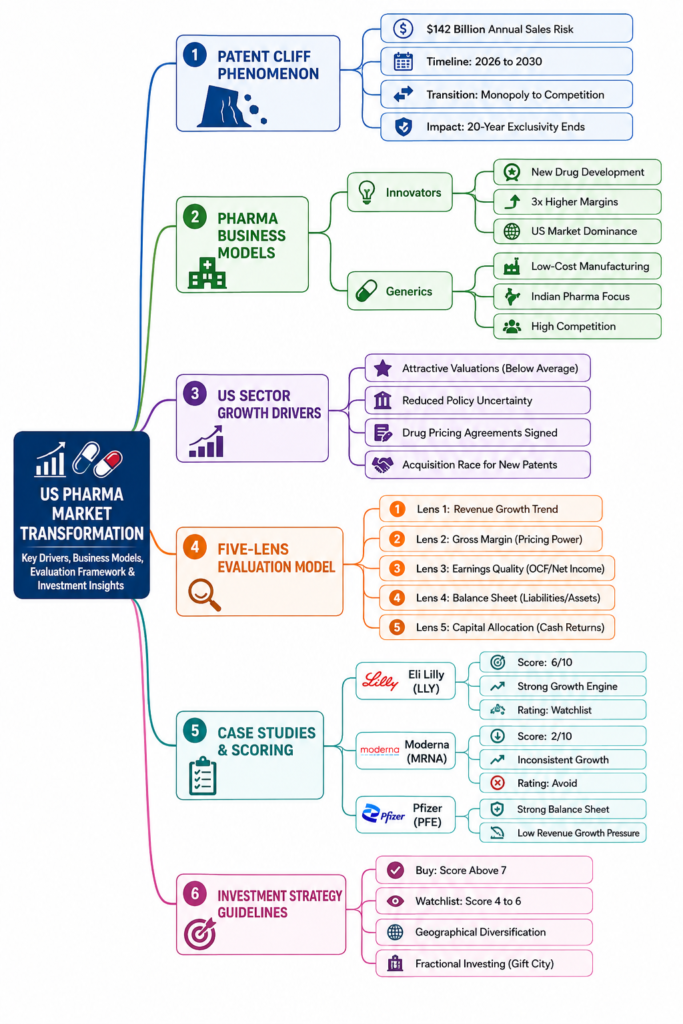
11. The Five-Lens Pharma Stock Scoring Model
To evaluate pharma companies systematically, investors can use a simple 10-point framework.
Lens 1 — Growth Engine
Formula:
5-Year Revenue Growth
Score:
- 2 points: Revenue consistently rising
- 1 point: One significant decline
- 0 points: Multiple declines without a clear recovery
Growth matters because pharma companies must continuously replace products approaching patent expiry.
12. Lens 2 — Pricing Power
Formula:
Gross Profit ÷ Revenue × 100
A high and stable gross margin can indicate:
- Strong products
- Pricing power
- Intellectual property
- Specialty medicines
- Efficient manufacturing
Score:
- 2: Margins consistently strong/rising
- 1: One temporary deterioration
- 0: Persistent margin deterioration
But investors should compare companies within the same business model.
A generic manufacturer and an innovative biotech should not automatically be judged by identical margin standards.
13. Lens 3 — Earnings Quality
Formula:
Operating Cash Flow ÷ Net Income
This is one of the most useful quality checks.
If a company reports ₹100 crore of profit and generates ₹120 crore of operating cash flow:
OCF / Net Income = 1.20
That is generally a healthy sign.
If profit is ₹100 crore but operating cash flow is only ₹60 crore:
OCF / Net Income = 0.60
That deserves investigation.
Score:
- 2: Consistently >1.0
- 1: Usually 0.8–1.0
- 0: Frequently below 0.8
However, this should be treated as a screening tool—not an automatic buy/sell signal.
14. Lens 4 — Balance Sheet Strength
Formula:
Total Liabilities ÷ Total Assets
Score:
- 2: <60%
- 1: 60–85%
- 0: >85%
A strong balance sheet becomes particularly valuable during patent transitions because companies may need capital for:
- R&D
- Acquisitions
- Manufacturing expansion
- Regulatory approvals
- Biosimilar development
Cash-rich companies have more strategic flexibility.
15. Lens 5 — Capital Allocation
Instead of simply looking at dividends, investors should examine how management deploys cash.
Look at:
- Dividends
- Buybacks
- Acquisitions
- R&D
- Debt reduction
- Capex
A company returning cash to shareholders while maintaining a healthy pipeline can be attractive.
But there is a warning:
A high payout ratio is not automatically good.
If management is returning cash because it has no attractive growth opportunities, the same metric can actually indicate a weak future pipeline.
16. The 10-Point Investment Framework
| Score | Interpretation |
|---|---|
| 8–10 | Strong candidate for deeper research |
| 6–7 | Attractive watchlist |
| 4–5 | Selective/small allocation |
| 0–3 | High-risk / avoid until fundamentals improve |
The score should never replace valuation analysis.
A great company bought at an extreme valuation can still produce poor returns.
17. Indian Pharma: Who Could Benefit?
The patent cliff creates a potentially attractive opportunity for Indian pharmaceutical companies with:
- US generics exposure
- Complex generics
- Biosimilar capabilities
- Specialty products
- Strong ANDA pipelines
- USFDA-approved facilities
- Manufacturing scale
- Strong regulatory track record
Companies highlighted in recent CareEdge-related reporting include:
- Sun Pharma
- Dr. Reddy’s Laboratories
- Lupin
- Zydus Lifesciences
- Natco Pharma
- Intas Pharmaceuticals
- MSN Laboratories
However, this does not mean every company will capture the same amount of opportunity. Market share, launch timing, competition and price erosion will determine actual earnings impact.
18. The Hidden Risk: Price Erosion
This is where many investors can make a mistake.
Patent expiry sounds bullish for generics.
But when 10 companies launch the same product, prices can collapse.
Therefore:
Patent expiry ≠ guaranteed profit.
The real formula is closer to:
Patent Expiry + Fast Approval + Limited Competition + Manufacturing Capability + Market Share = Potential Profit
This is why complex generics and biosimilars may be more attractive than commoditised products.
19. The US Innovator Side of the Equation
Indian investors often focus exclusively on generic manufacturers.
But the other side of the equation is equally important.
The major innovator companies include businesses such as:
- Eli Lilly
- Pfizer
- Merck
- Bristol Myers Squibb
- Johnson & Johnson
- AbbVie
- Novartis
- Gilead
- Roche
- AstraZeneca
Their challenge is different.
They must replace revenue lost from ageing products with:
New drugs + acquisitions + licensing + pipeline innovation.
This creates a fascinating investment framework:
Generic strategy
Buy companies positioned to capture products after exclusivity.
Innovator strategy
Buy companies capable of replacing expiring products before the revenue disappears.
The best investor may therefore need to understand both sides.
20. Why Pharma M&A Could Become a Major Theme
Patent expiry creates a pipeline problem.
M&A provides a potential solution.
A company facing a $10 billion revenue hole may spend billions acquiring a drug platform capable of generating future growth.
That creates a chain reaction:
Patent expiry → Revenue risk → Pipeline gap → M&A → Biotech valuation → New drug launch
The important point is that M&A is not always automatically positive.
Large acquisitions can destroy shareholder value if management:
- Overpays
- Misjudges clinical potential
- Fails to integrate the asset
- Takes on excessive debt
- Buys late-stage assets at inflated valuations
Recent industry commentary has increasingly emphasized smaller, targeted “bolt-on” transactions rather than purely defensive mega-deals.
21. A New Metric Investors Should Track: Revenue at Risk
Traditional investors often focus on:
P/E
But pharma investors should also calculate:
Revenue at Risk
Revenue from products approaching loss of exclusivity ÷ Total Revenue
Example:
If a pharma company generates ₹10,000 crore of revenue and ₹3,000 crore comes from products facing major exclusivity pressure:
Revenue at Risk = 30%
Now compare two companies:
| Company | Revenue | Revenue at Risk | Pipeline Growth |
|---|---|---|---|
| Pharma A | ₹10,000 Cr | 30% | Strong |
| Pharma B | ₹10,000 Cr | 10% | Weak |
Company A has higher immediate risk but potentially stronger future growth.
Company B has lower patent risk but could face a growth problem.
That is why pipeline quality matters more than simply counting patents.
22. The Global Pharma Investment Scorecard
Before investing in a pharma stock, ask these 10 questions:
- How much revenue comes from products facing patent expiry?
- What percentage of revenue comes from the top five products?
- How strong is the company’s pipeline?
- How much is spent on R&D?
- Are R&D expenses producing successful launches?
- How strong is operating cash flow?
- Is debt increasing?
- Is management overpaying for acquisitions?
- How exposed is the company to US pricing pressure?
- What is the current valuation compared with its historical average?
This framework is much more powerful than simply asking:
“Is the P/E cheap?”
23. How Indian Investors Can Access Global Pharma
Geographical diversification has become easier for Indian investors.
NSE IFSC has developed mechanisms for accessing international securities, including fractional exposure to US stocks, while the RBI’s Liberalised Remittance Scheme allows eligible resident individuals to remit up to $250,000 per financial year for permitted transactions.
In 2026, several Indian financial platforms have also expanded US-stock access through the GIFT City/IFSC framework.
However, investors should separately evaluate:
- Brokerage
- Currency conversion
- Taxation
- Dividend withholding
- Platform structure
- Regulatory rules
- LRS limits
Access becoming easier does not automatically make every US pharma stock a good investment.
24. The Bigger Investment Thesis
The pharma industry is moving from an era of:
“One blockbuster drug = decades of growth”
toward:
“Continuous innovation = sustainable growth.”
The next decade could reward companies that can repeatedly:
Discover → Develop → Patent → Launch → Scale → Replace
That applies to both sides of the industry.
For innovators:
Pipeline strength is the moat.
For generics:
Manufacturing + regulatory expertise + speed-to-market is the moat.
For biosimilars:
Scientific capability + manufacturing scale + regulatory execution is the moat.
25. Final Verdict: Don’t Just Buy the Patent Cliff
The $142 billion patent cliff is a major structural event—but it should not be treated as a simple “buy pharma” signal.
The real opportunity lies in identifying who captures the economics.
The key questions are:
Which blockbuster drugs are losing exclusivity?
Which companies are prepared to launch alternatives?
How much price erosion is expected?
Which innovators have enough pipeline growth to replace lost revenue?
Which companies have the balance sheet to acquire the next blockbuster?
And finally—what price are you paying for that growth?
The pharmaceutical industry is entering a period where intellectual property, pipeline quality, biosimilars, generics and M&A will increasingly determine shareholder returns.
The investor who looks only at the P/E ratio is looking backward.
The investor who studies patent expiry + revenue at risk + pipeline + cash flow + valuation is looking forward.
The final question is simple:
Are you buying the company whose blockbuster is about to lose its exclusive license—or the company ready to own the next license?
Key Data Sources
- CareEdge Ratings — Patent expiry and Indian pharma opportunity: approximately $142B annual sales exposed, $30–40B+ global opportunity and $3–5B potential Indian opportunity.
- J.P. Morgan — 2026 healthcare trends and pharma/biotech M&A outlook.
- Pfizer 2025 Annual Report — revenue, cash flow and expected 2026–2030 exclusivity pressure.
- Eli Lilly 2025 Annual Report — revenue and major-product growth data.
- Reuters — 2026 biotech M&A and patent-cliff dynamics.
Investor Disclaimer
This article is for educational and research purposes only. Patent expiry does not guarantee profitability for generic manufacturers, and strong pipeline growth does not guarantee future returns for innovator companies. Investors should independently evaluate financial statements, valuation, regulatory risks, patent litigation, product concentration, competition and their own risk tolerance before making investment decisions.
Top 10 SEO titles:
- $142 Billion Pharma Patent Cliff: Top Opportunities for Investors in 2026–2030
- Pharma Patent Cliff 2026–2030: The $142 Billion Opportunity Explained
- The $142 Billion Pharma Patent Cliff: Which Stocks Could Benefit?
- Pharma Patent Expiry 2026–2030: Indian Pharma Stocks to Watch
- $142 Billion Patent Cliff: Why Global Pharma Is Entering a New Era
- Global Pharma Patent Cliff 2026–2030: Winners, Losers & Investment Opportunities
- Pharma Patent Cliff: How $142 Billion in Drug Sales Could Reshape the Industry
- Indian Pharma Stocks & the $142 Billion Patent Cliff: Complete Investor Guide
- Patent Cliff 2026: The Next Big Opportunity in Global Pharma Stocks
- $142 Billion Pharma Shake-Up: Patent Expiry, Biosimilars & Pharma M&A Explained