
Introduction: The Market That Looks Boring but Isn’t
A market doesn’t need to crash 500 points to damage investor returns.
Sometimes, the more frustrating environment is a slow, range-bound market where the Nifty repeatedly moves between support and resistance without producing a sustainable trend.
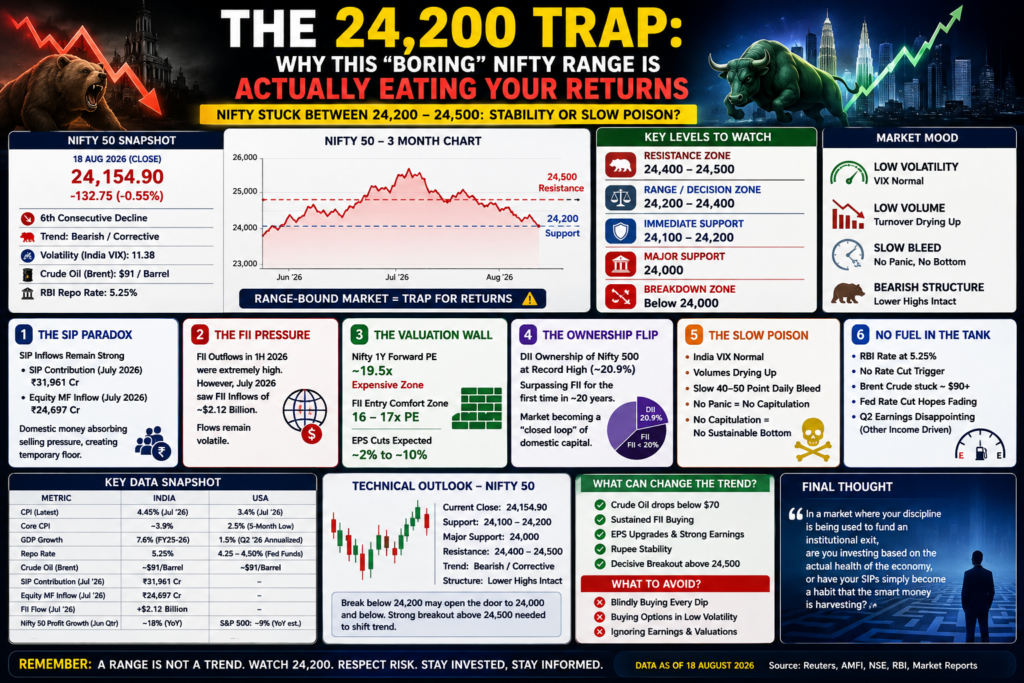
The 24,200–24,500 zone has become an important battleground for traders and investors. On August 18, 2026, Nifty 50 closed at 24,154.90, down 132.75 points or 0.55%, extending its losing streak to six sessions.
The important question is no longer simply:
“Will Nifty fall?”
The bigger question is:
“Is 24,200 a genuine demand zone—or merely a temporary pause before another leg lower?”
1. The 24,200 Battle: Why This Level Matters
The 24,200 level has emerged as a major technical reference point.
Before the August 18 session, market analysts were already identifying 24,200 as immediate support, with the 24,400–24,500 area acting as resistance. A sustained break below 24,200 was viewed as a potential trigger toward 24,000.
That makes the market structure relatively simple:
| Nifty Zone | Interpretation |
|---|---|
| Above 24,500 | Bullish breakout potential |
| 24,400–24,500 | Major resistance |
| 24,200–24,400 | Range/decision zone |
| Below 24,200 | Bearish pressure increases |
| 24,000 | Major psychological support |
| Below 24,000 | Structural risk increases |
The August 18 close below 24,200 therefore matters because a previous support area can become resistance after a breakdown.
Recent technical commentary has identified 24,100–24,150 as the next support zone, followed by 24,000.
2. The SIP Paradox: Domestic Money Is Still Coming
One of the biggest structural changes in India’s market is the growing importance of domestic investors.
And this is where the “retail investors are funding the FII exit” argument needs nuance.
SIP money is not automatically exit liquidity.
In fact, SIP investing is designed to continue through both bull and bear markets, allowing investors to accumulate units at different prices.
The scale is nevertheless enormous.
According to AMFI, SIP contributions reached approximately ₹31,781 crore in June 2026.
July data reported by Reuters showed SIP contributions around ₹31,961 crore, close to the March record of ₹32,087 crore. Equity mutual-fund inflows, meanwhile, stood at ₹24,697 crore.
This creates an important market dynamic:
Foreign selling can pressure prices, while domestic flows can absorb part of that supply.
That can explain why markets sometimes fall slowly instead of experiencing a sudden collapse.
The real paradox
Domestic investors may be creating a structural floor, but that doesn’t automatically create a structural uptrend.
That’s the difference.
3. FII Selling: The Real Pressure Point
Foreign capital remains one of the most important variables for Indian equities.
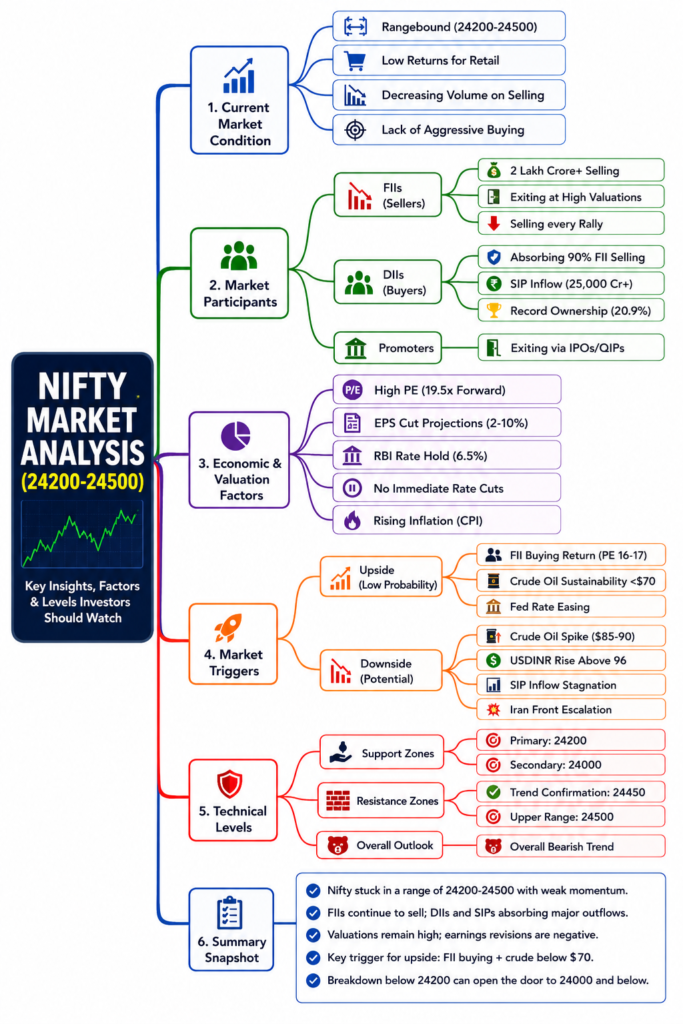
Earlier in 2026, FII selling was exceptionally heavy. By May, reports indicated that FIIs had withdrawn more than ₹2 lakh crore from India’s secondary market in the first four months of 2026.
However, the story has changed somewhat.
Reuters reported that foreign investors purchased approximately $2.12 billion of Indian equities in July, while August also saw a return of foreign buying in the first half of the month, according to reports.
So the better interpretation is:
FII flows are volatile—not simply “FIIs are permanently exiting India.”
This distinction is extremely important for investors.
If foreign investors begin consistently buying large-cap Indian equities again, the Nifty could receive a powerful liquidity boost.
4. The Valuation Wall: Price vs Earnings
Another reason the market can struggle even without a dramatic economic slowdown is valuation.
The basic PE formula is simple:
P/E = Market Price ÷ Earnings Per Share
NSE explains that index PE is calculated using the market capitalisation of constituents relative to their aggregate earnings.
The problem appears when earnings expectations fall.
Imagine:
- Stock price = ₹1,000
- EPS = ₹50
- PE = 20×
Now EPS falls to ₹45.
The same ₹1,000 price suddenly represents:
₹1,000 ÷ ₹45 = 22.2× PE
Nothing happened to the stock price.
But the valuation became more expensive.
This is why EPS downgrades can create a valuation wall even when the market isn’t crashing.
What investors should monitor
Don’t look at PE alone.
Track:
- Forward EPS
- Earnings revisions
- Revenue growth
- EBITDA margin
- ROE
- Credit growth
- FII ownership
- DII flows
- Free cash flow
A high PE can be justified when earnings growth is accelerating.
A high PE becomes dangerous when earnings expectations are falling.
5. The Ownership Shift: India’s Domestic Investor Revolution
India’s market structure has changed dramatically over the last decade.
SIP participation has transformed mutual funds into a major channel for household savings entering equities.
AMFI data shows how significant this shift has become. Monthly SIP contributions increased from just ₹3,122 crore in April 2016 to ₹25,926 crore in March 2025, according to the AMFI-Crisil factbook.
By July 2025, SIP contributions had reached ₹28,464 crore, with 9.11 crore contributing SIP accounts.
This means the Indian market is no longer completely dependent on foreign capital.
That’s a structural strength.
But there is also a limitation.
Domestic liquidity can absorb selling, but it cannot guarantee rising valuations.
Eventually, earnings have to justify prices.
6. The Silent Signal: India VIX
One of the most interesting signals in the current market is the relatively contained volatility.
India VIX was around 11.38 on August 18, barely changed from the previous day’s 11.36, even as Nifty remained under pressure.
This creates an unusual setup:
Nifty ↓
VIX →
Panic → Low
That doesn’t necessarily mean the market is safe.
It means investors are not pricing an extreme crash.
A sudden increase in VIX combined with a Nifty breakdown below 24,000 would be a much more serious warning.
7. Crude Oil: The Macro Variable Investors Cannot Ignore
The other major problem is crude oil.
Brent crude was hovering around $91 per barrel on August 18, after rising nearly 9% in two weeks amid renewed Middle East tensions.
For India, expensive crude can affect:
- Inflation
- Current-account balance
- Rupee
- Transportation costs
- Corporate margins
- Consumer spending
- RBI policy expectations
This creates a chain reaction:
Crude ↑ → Inflation risk ↑ → Rupee pressure ↑ → Rate-cut expectations ↓ → Equity valuation pressure ↑
That is why crude remains one of the most important variables for the Nifty.
8. RBI Rate: The Missing Liquidity Catalyst?
The RBI policy repo rate currently stands at 5.25%, according to RBI data.
The market therefore needs to watch the relationship between:
Inflation + Crude + Rupee + RBI policy
If inflation remains controlled and crude falls substantially, expectations of easier monetary policy could return.
But if crude remains elevated and inflation accelerates, the market may have to operate without the benefit of aggressive monetary easing.
That can keep valuation expansion limited.
9. Earnings Are the Counterweight
There is, however, an important bullish argument that should not be ignored.
Indian corporate earnings have not collapsed.
Reuters reported that Nifty 50 companies delivered approximately 18% average profit growth in the June 2026 quarter, the strongest growth in 10 quarters. The upgrade-to-downgrade ratio also improved to around 1.5, suggesting a relatively constructive earnings outlook.
This creates a major contradiction:
Price action = Weak
Corporate earnings = Relatively Strong
That means the current correction may be more about:
valuation + liquidity + geopolitics + crude
rather than an outright collapse in corporate profitability.
10. The Nifty 24,200–24,500 Trading Map
For traders, the market can be simplified into three scenarios.
🔴 Scenario 1: Bearish Breakdown
Nifty decisively breaks below 24,200
Possible path:
24,200 → 24,100 → 24,000
A sustained move below 24,000 would increase the probability of a deeper correction.
🟡 Scenario 2: Range Continues
Nifty remains between:
24,200–24,500
This would continue to punish aggressive option buyers through:
- Time decay
- False breakouts
- Whipsaws
- Low volatility
- Premium erosion
This is arguably the most frustrating environment for short-term traders.
🟢 Scenario 3: Bullish Breakout
Nifty reclaims:
24,400 → 24,500
with strong volume and broader market participation.
That would weaken the bearish structure and could trigger short covering.
11. What Could End the 24,200 Trap?
Watch these five triggers:
1. Crude Oil
A sustained decline in crude would remove a major macro risk.
2. FII Buying
Consistent foreign buying would provide fresh liquidity.
3. Earnings Upgrades
Positive EPS revisions could justify higher valuations.
4. Rupee Stability
A stable rupee reduces pressure on foreign investors and inflation expectations.
5. Nifty 24,500 Breakout
A decisive breakout above resistance could technically change the market structure.
12. What Investors Should Avoid
During a range-bound market, three mistakes become particularly expensive.
❌ Blindly buying every dip
24,200 is support—not a guarantee.
❌ Buying calls simply because Nifty is “cheap”
Low-volatility ranges can destroy option premiums through time decay.
❌ Assuming SIP flows guarantee a market bottom
SIP flows create persistent demand, but they do not override valuations, earnings,s or global liquidity.
Nifty 50 Market Snapshot
| Indicator | Current Situation |
|---|---|
| Nifty 50 | 24,154.90 |
| Day Change | -132.75 / -0.55% |
| Trend | Bearish / Corrective |
| Immediate Support | 24,100–24,200 |
| Major Support | 24,000 |
| Resistance | 24,400–24,500 |
| India VIX | ~11.38 |
| Crude Oil | ~$91/barrel |
| RBI Repo Rate | 5.25% |
| June SIP Contribution | ₹31,781 crore |
| July Equity MF Inflows | ₹24,697 crore |
| June Quarter Nifty Profit Growth | ~18% |
Sources: NSE/market reports, RBI, AMFI and Reuters.
Conclusion: Don’t Confuse Stability With Strength
The 24,200–24,500 Nifty range is not necessarily a sign that the market is healthy.
It is a battle.
On one side:
Domestic SIP + DII liquidity + corporate earnings
On the other:
FII flows + crude oil + global yields + valuation concerns + geopolitical risk
The most important technical level remains 24,200.
A sustained breakdown could open the door toward 24,000 and below, while a decisive recovery above 24,500 would invalidate much of the immediate bearish setup.
But investors should remember one thing:
A range is not a trend.
Until Nifty chooses a direction, patience and position sizing may matter more than prediction.
The real question isn’t whether the market is boring.
The real question is whether 24,200 is building a base—or preparing the next breakdown.
SEO FAQ
Is 24,200 an important support for Nifty 50?
Yes. Recent market analysis has identified 24,200 as an important immediate support, with 24,000 becoming the next major psychological level if 24,200 breaks decisively.
What is the Nifty 50 resistance level?
The 24,400–24,500 zone is currently an important resistance area.
Are SIP investors supporting the Indian stock market?
Yes. SIP contributions remain extremely large, with June 2026 contributions at about ₹31,781 crore.
Is FII selling still a major risk?
FII flows remain important, but the picture is not one-way. Foreign investors were reported as buyers in July 2026, showing that flows can reverse quickly as valuations and global conditions change.
Why is crude oil important for Nifty?
India is highly sensitive to energy prices. Higher crude can increase inflation and pressure the rupee, corporate margins and monetary-policy expectations. Brent was around $91/barrel on August 18.
Is the Indian market fundamentally weak?
Not necessarily. June-quarter Nifty 50 companies reportedly delivered around 18% average profit growth, showing that earnings remain an important source of support despite weak price action.
Disclaimer: This article is for educational and informational purposes only and should not be treated as investment advice. Market levels and macro data can change rapidly.
Alternative SEO Titles
- Nifty 50 at 24,200: Is the Market Heading for a Bigger Breakdown?
- Why Nifty Is Struggling at 24,200–24,500: FII, SIP and Valuation Explained
- Nifty 50 Bearish Trend: 24,200 Support, FII Flows and SIP Inflows Explained
- The 24,200 Trap: Nifty Range-Bound Market Signals Investors Should Watch
- Nifty Outlook 2026: FII Selling, SIP Flows and the 24,200 Support Level